Mercury Insurance 2010 Annual Report Download - page 11
Download and view the complete annual report
Please find page 11 of the 2010 Mercury Insurance annual report below. You can navigate through the pages in the report by either clicking on the pages listed below, or by using the keyword search tool below to find specific information within the annual report.-
 1
1 -
 2
2 -
 3
3 -
 4
4 -
 5
5 -
 6
6 -
 7
7 -
 8
8 -
 9
9 -
 10
10 -
 11
11 -
 12
12 -
 13
13 -
 14
14 -
 15
15 -
 16
16 -
 17
17 -
 18
18 -
 19
19 -
 20
20 -
 21
21 -
 22
22 -
23
-
24
-
25
-
26
-
27
-
28
-
29
-
30
-
31
-
32
-
33
-
34
-
35
-
36
-
37
-
38
-
39
-
40
-
41
-
42
-
43
-
44
-
45
-
46
-
47
-
48
-
49
-
50
-
51
-
52
-
53
-
54
-
55
-
56
-
57
-
58
-
59
-
60
-
61
-
62
-
63
-
64
-
65
-
66
-
67
-
68
-
69
-
70
-
71
-
72
-
73
-
74
-
75
-
76
-
77
-
78
-
79
-
80
-
81
-
82
-
83
-
84
-
85
-
86
-
87
-
88
-
89
-
90
-
91
-
92
-
93
-
94
-
95
-
96
-
97
-
98
-
99
-
100
-
101
-
102
-
103
-
104
-
105
-
106
-
107
-
108
-
109
-
110
-
111
-
112
-
113
-
114
-
115
-
116
-
117
-
118
-
119
-
120
-
121
-
122
-
123
-
124
-
125
-
126
 |
 |

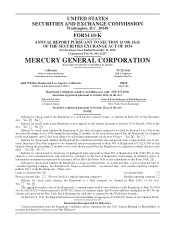
PART I
Item 1. Business
General
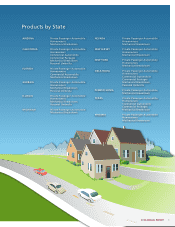
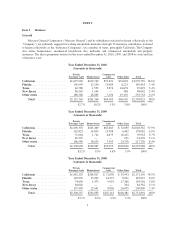
Mercury General Corporation (“Mercury General”) and its subsidiaries (referred to herein collectively as the
“Company”) are primarily engaged in writing automobile insurance through 13 insurance subsidiaries (referred
to herein collectively as the “Insurance Companies”) in a number of states, principally California. The Company
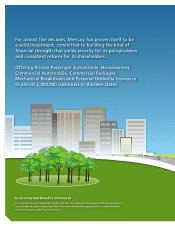
also writes homeowners, mechanical breakdown, fire, umbrella, and commercial automobile and property
insurance. The direct premiums written for the years ended December 31, 2010, 2009, and 2008 by state and line
of business were:
Year Ended December 31, 2010
(Amounts in thousands)
Private
Passenger Auto Homeowners
Commercial
Auto Other Lines Total
California ..................... $1,627,938 $219,749 $57,451 $54,601 $1,959,739 76.6%
Florida ........................ 156,959 12,250 13,984 6,225 189,418 7.4%
Texas ......................... 63,788 1,552 5,874 16,678 87,892 3.4%
New Jersey .................... 86,510 1,144 — 388 88,042 3.4%
Other states .................... 180,568 26,865 7,194 19,107 233,734 9.2%
Total ..................... $2,115,763 $261,560 $84,503 $96,999 $2,558,825 100%
82.7% 10.2% 3.3% 3.8% 100%
Year Ended December 31, 2009
(Amounts in thousands)
Private
Passenger Auto Homeowners
Commercial
Auto Other Lines Total
California ..................... $1,696,378 $205,469 $65,685 $ 52,830 $2,020,362 77.9%
Florida ........................ 142,823 14,859 13,998 6,402 178,082 6.9%
Texas ......................... 71,064 1,724 6,679 16,451 95,918 3.7%
New Jersey .................... 81,225 — — 251 81,476 3.1%
Other states .................... 166,548 18,833 7,593 24,756 217,730 8.4%
Total ..................... $2,158,038 $240,885 $93,955 $100,690 $2,593,568 100%
83.2% 9.3% 3.6% 3.9% 100%
Year Ended December 31, 2008
(Amounts in thousands)
Private
Passenger Auto Homeowners
Commercial
Auto Other Lines Total
California ..................... $1,842,129 $204,027 $ 72,050 $ 52,993 $2,171,199 78.9%
Florida ........................ 145,952 15,892 16,272 8,921 187,037 6.8%
Texas ......................... 74,690 1,473 9,995 17,368 103,526 3.8%
New Jersey .................... 84,028 — — 304 84,332 3.1%
Other states .................... 157,438 12,641 8,826 26,895 205,800 7.4%
Total ..................... $2,304,237 $234,033 $107,143 $106,481 $2,751,894 100%
83.7% 8.5% 3.9% 3.9% 100%
1