Mercury Insurance 2010 Annual Report Download - page 14
Download and view the complete annual report
Please find page 14 of the 2010 Mercury Insurance annual report below. You can navigate through the pages in the report by either clicking on the pages listed below, or by using the keyword search tool below to find specific information within the annual report.-
 1
1 -
2
-
3
-
 4
4 -
 5
5 -
 6
6 -
 7
7 -
 8
8 -
 9
9 -
 10
10 -
 11
11 -
 12
12 -
 13
13 -
 14
14 -
 15
15 -
 16
16 -
 17
17 -
 18
18 -
 19
19 -
 20
20 -
 21
21 -
 22
22 -
 23
23 -
 24
24 -
25
-
26
-
27
-
28
-
29
-
30
-
31
-
32
-
33
-
34
-
35
-
36
-
37
-
38
-
39
-
40
-
41
-
42
-
43
-
44
-
45
-
46
-
47
-
48
-
49
-
50
-
51
-
52
-
53
-
54
-
55
-
56
-
57
-
58
-
59
-
60
-
61
-
62
-
63
-
64
-
65
-
66
-
67
-
68
-
69
-
70
-
71
-
72
-
73
-
74
-
75
-
76
-
77
-
78
-
79
-
80
-
81
-
82
-
83
-
84
-
85
-
86
-
87
-
88
-
89
-
90
-
91
-
92
-
93
-
94
-
95
-
96
-
97
-
98
-
99
-
100
-
101
-
102
-
103
-
104
-
105
-
106
-
107
-
108
-
109
-
110
-
111
-
112
-
113
-
114
-
115
-
116
-
117
-
118
-
119
-
120
-
121
-
122
-
123
-
124
-
125
-
126
 |
 |
contractors selected and contracted by the Company. No independent agent or broker accounted for more than
2% of the Company’s direct premiums written during 2010 and 2009. However, AIS produced approximately
15% of the Company’s direct premiums written during 2008 prior to the AIS acquisition.
The Company believes that it compensates its agents and brokers above the industry average. During 2010,
total commissions incurred were approximately 17% of net premiums written.
The Company’s advertising budget is allocated among television, radio, newspaper, internet, and direct
mailing media to provide the best coverage available within targeted media markets. While the majority of these
advertising costs are borne by the Company, a portion of these costs are reimbursed by the Company’s
independent agents based upon the number of account leads generated by the advertising. The Company believes
that its advertising program is important to create brand awareness and to remain competitive in the current
insurance climate. During 2010, net advertising expenditures were $30 million.
Underwriting
The Company sets its own automobile insurance premium rates, subject to rating regulations issued by the
Departments of Insurance (“DOI”) or similar governmental agencies of the applicable states. Each state has
different rate approval requirements. See “Regulation—Department of Insurance Oversight.”
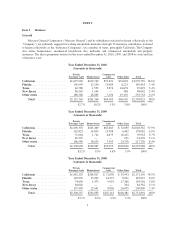
The Company offers standard, non-standard, and preferred private passenger automobile insurance. Private
passenger automobile policies in force for non-California operations represented approximately 22% of total
private passenger automobile policies in force at December 31, 2010. In addition, the Company offers
mechanical breakdown insurance in many states and homeowners insurance in Florida, Illinois, Oklahoma, New
York, Georgia, Texas, New Jersey, Virginia, and Arizona. The Company is in the process of withdrawing from
the Florida homeowners market and expects to complete the withdrawal in 2012.
In California, “good drivers” (as defined by the California Insurance Code) accounted for approximately
81% of all California voluntary private passenger automobile policies in force at December 31, 2010, while
higher risk categories accounted for approximately 19%. The private passenger automobile renewal rate in
California (the rate of acceptance of offers to renew) averages approximately 96%. The Company also offers
homeowners, mechanical breakdown, and commercial automobile and property insurance in California.
Claims
The Company conducts the majority of claims processing without the assistance of outside adjusters. The
claims staff administer all claims and direct all legal and adjustment aspects of claims processing.
Losses and Loss Adjustment Expenses Reserves and Reserve Development
The Company maintains losses and loss adjustment expenses reserves for both reported and unreported
claims. Losses and loss adjustment expenses reserves for reported claims are estimated based upon a
case-by-case evaluation of the type of claim involved and the expected development of such claim. Losses and
loss adjustment expenses reserves for unreported claims are determined on the basis of historical information by
line of insurance. Inflation is reflected in the reserving process through analysis of cost trends and review of
historical reserve settlement.
The Company’s ultimate liability may be greater or less than management estimates of reported losses and
loss adjustment expenses reserves. Reserves are closely monitored and are analyzed quarterly by the Company’s
actuarial consultants using current information on reported claims and a variety of statistical techniques. The
4