Merck 2010 Annual Report Download - page 4
Download and view the complete annual report
Please find page 4 of the 2010 Merck annual report below. You can navigate through the pages in the report by either clicking on the pages listed below, or by using the keyword search tool below to find specific information within the annual report.-
 1
1 -
 2
2 -
 3
3 -
 4
4 -
 5
5 -
 6
6 -
 7
7 -
 8
8 -
 9
9 -
 10
10 -
 11
11 -
 12
12 -
 13
13 -
 14
14 -
 15
15 -
16
-
17
-
18
-
19
-
20
-
21
-
22
-
23
-
24
-
25
-
26
-
27
-
28
-
29
-
30
-
31
-
32
-
33
-
34
-
35
-
36
-
37
-
38
-
39
-
40
-
41
-
42
-
43
-
44
-
45
-
46
-
47
-
48
-
49
-
50
-
51
-
52
-
53
-
54
-
55
-
56
-
57
-
58
-
59
-
60
-
61
-
62
-
63
-
64
-
65
-
66
-
67
-
68
-
69
-
70
-
71
-
72
-
73
-
74
-
75
-
76
-
77
-
78
-
79
-
80
-
81
-
82
-
83
-
84
-
85
-
86
-
87
-
88
-
89
-
90
-
91
-
92
-
93
-
94
-
95
-
96
-
97
-
98
-
99
-
100
-
101
-
102
-
103
-
104
-
105
-
106
-
107
-
108
-
109
-
110
-
111
-
112
-
113
-
114
-
115
-
116
-
117
-
118
-
119
-
120
-
121
-
122
-
123
-
124
-
125
-
126
-
127
-
128
-
129
-
130
-
131
-
132
-
133
-
134
-
135
-
136
-
137
-
138
-
139
-
140
-
141
-
142
-
143
-
144
-
145
-
146
-
147
-
148
-
149
-
150
-
151
-
152
-
153
-
154
-
155
-
156
-
157
-
158
-
159
-
160
-
161
-
162
-
163
-
164
-
165
-
166
-
167
-
168
-
169
-
170
-
171
-
172
-
173
-
174
-
175
-
176
-
177
-
178
-
179
-
180
-
181
-
182
-
183
-
184
-
185
-
186
-
187
-
188
-
189
-
190
-
191
-
192
-
193
-
194
-
195
-
196
-
197
-
198
-
199
-
200
-
201
-
202
-
203
-
204
-
205
-
206
-
207
-
208
-
209
-
210
-
211
-
212
-
213
-
214
-
215
-
216
-
217
-
218
-
219
-
220
-
221
-
222
-
223
 |
 |

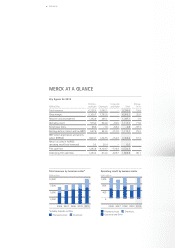
This overview may include historically adjusted values in order to ensure comparability with 2010
Change vs. 2009
in %
EUR million 2001 2002 2003 2004 2005 2006 2007 2008 2009 2010
Total revenues by division 7,721 7,521 7,364 6,017 5,887 6,310 7,081 7,590 7,747 9,291 19.9
Pharmaceuticals 3,484 3,265 3,458 3,601 3,905 4,163 4,900 5,456 5,812 6,226 7.1
Merck Serono 2,228 1,850 1,546 1,619 1,817 1,938 4,480 5,014 5,345 5,754 7.6
Generics 2936 1,096 1,585 1,625 1,712 1,825 –––––
Consumer Health Care 320 319 327 357 376 400 420 442 467 472 1.1
Chemicals 1,729 1,791 1,707 1,696 1,906 2,113 2,152 2,127 1,935 3,065 58.4
Merck Millipore – – – – – – – – 9291,681 80.9
Performance Materials – – – – – – – – 1,0061,384 37.7
Liquid Crystals 297 383 443 589 741 895 916 878 – – –
Performance & Life Science Chemicals 1,216 1,216 1,083 1,107 1,165 1,218 1,236 1,249 – – –
Electronic Chemicals 2216 192 181 – – – – – – – –
Laboratory Distribution 22,754 2,711 2,427 582 –––––––
Intragroup sales, Laboratory –246 –246 –228 –62 –––––––
Corporate and Other – – – 200 76 34 29 7 – – –
Operating result by business sector 877 616 736 776 883 1,105 976 1,131 649 1,113 71.6
Pharmaceuticals 581 272 389 391 454 524 417 655 403 579 43.7
Chemicals 204 260 316 420 492 641 631 558 324 624 92.4
Laboratory Distribution 292 84 79 21 –––––––
Corporate and Other – – –48 –56 –63 –60 –72 –81 –78 –90 14.1
Earnings before income and taxes (EBIT) 1,286 559 538 1,044 956 1,325 200 731 621 1,113 79.2
EBIT before depreciation and amortization (EBITDA) 1,694 985 1,008 1,419 1,245 1,628 1,858 1,947 1,625 2,457 51.2
Profit before tax 1,078 412 423 961 893 1,273 –111 575 486 861 77.0
Profit after tax 655 215 218 672 673 1,001 3,520 379 377 642 70.3
Free cash flow 664 441 442 1,889 657 –1,073 –1,473 438 812 –3,522 –
Capital expenditure on property, plant and equipment 470 377 281 234 268 253 283 395 467 396 –15.2
Research and development 577 608 605 599 713 752 1,028 1,234 1,345 1,397 3.9
Total assets 8,255 7,511 6,982 5,754 7,281 8,102 14,922 15,645 16,713 22,388 34.0
Net equity 2,336 2,054 2,363 2,800 3,329 3,807 8,688 9,563 9,514 10,372 9.0
Employees (number as of December 31) 34,294 34,504 34,206 28,877 29,133 29,999 30,968 32,800 33,062 40,562 22.7
Return on sales in % (ROS: Operating result/total revenues) 11.4 8.2 10.0 12.9 15.0 17.5 13.8 14.9 8.4 12.0
Earnings per share in EUR 3.66 1.18 1.15 3.47 3.40 5.07 16.211.69 1.68 2.91 73.2
Dividend per share in EUR 0.95 1.00 0.80 0.80 0.85 0.90 1.20 1.50 1.00 1.25 25.0
One-time bonus per share in EUR – – – 0.20 –0.15 2.00 – – – –
Contents
EUR million
10,000
7,500
5,000
2,500
2006 2007 2008 2009 2010
Pharmaceuticals Chemicals
EUR million
1,200
800
400
0
2006 2007 2008 2009 2010
Pharmaceuticals Chemicals
Corporate and Other
Contents
EUR million
Pharma-
ceuticals Chemicals
Corporate
and Other Total
Change
in %
Total revenues 6,225.5 3,065.1 – 9,290.6 19.9
Gross margin 5,109.7 1,795.5 – 6,905.2 20.8
Research and development 1,192.0 205.1 – 1,397.1 3.9
Operating result 579.0 624.0 –89.5 1,113.5 71.6
Exceptional items 68.6 –1.0 –68.4 –0.8 –97.3
Earnings before interest and tax (EBIT) 647.6 623.0 –157.9 1,112.7 79.2
EBIT before depreciation and amorti-
zation (EBITDA) 1,603.7 1,007.5 –154.3 2,456.9 51.2
Return on sales in % (ROS:
operating result/total revenues) 9.3 20.4 – 12.0
Free cash flow 1,343.6 –4,129.7 –736.4 –3,522.5 –
Underlying free cash flow 1,353.3 812.2 –495.7 1,669.8 96.1