McKesson 2012 Annual Report Download - page 2
Download and view the complete annual report
Please find page 2 of the 2012 McKesson annual report below. You can navigate through the pages in the report by either clicking on the pages listed below, or by using the keyword search tool below to find specific information within the annual report.-
 1
1 -
 2
2 -
 3
3 -
 4
4 -
 5
5 -
 6
6 -
 7
7 -
 8
8 -
 9
9 -
 10
10 -
 11
11 -
 12
12 -
 13
13 -
14
-
15
-
16
-
17
-
18
-
19
-
20
-
21
-
22
-
23
-
24
-
25
-
26
-
27
-
28
-
29
-
30
-
31
-
32
-
33
-
34
-
35
-
36
-
37
-
38
-
39
-
40
-
41
-
42
-
43
-
44
-
45
-
46
-
47
-
48
-
49
-
50
-
51
-
52
-
53
-
54
-
55
-
56
-
57
-
58
-
59
-
60
-
61
-
62
-
63
-
64
-
65
-
66
-
67
-
68
-
69
-
70
-
71
-
72
-
73
-
74
-
75
-
76
-
77
-
78
-
79
-
80
-
81
-
82
-
83
-
84
-
85
-
86
-
87
-
88
-
89
-
90
-
91
-
92
-
93
-
94
-
95
-
96
-
97
-
98
-
99
-
100
-
101
-
102
-
103
-
104
-
105
-
106
-
107
-
108
-
109
-
110
-
111
-
112
-
113
-
114
-
115
-
116
-
117
-
118
-
119
-
120
-
121
-
122
-
123
-
124
-
125
-
126
-
127
-
128
 |
 |

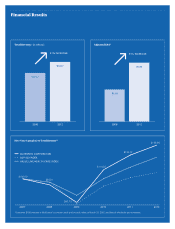
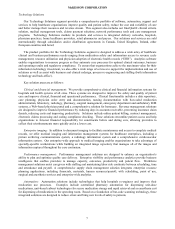
201220112010200920082007
McKESSON CORPORATION
S&P 500 INDEX
VALUE LINE HEALTH CARE INDEX
$139.72
$156.68
$114.92
$60.73
$89.81
$100.00
**Assumes $100 invested in McKesson’s common stock and in each index on March 31, 2007, and that all dividends are reinvested.
Financial Results
20122008
$101.7
$122.7
21% INCREASE
2008
$3.53
$6.38
81% INCREASE
2012
Total Revenue (in billions) Adjusted EPS*
Five-Year Cumulative Total Return**