MasterCard 2006 Annual Report Download - page 22
Download and view the complete annual report
Please find page 22 of the 2006 MasterCard annual report below. You can navigate through the pages in the report by either clicking on the pages listed below, or by using the keyword search tool below to find specific information within the annual report.-
 1
1 -
2
-
3
-
4
-
5
-
6
-
7
-
8
-
9
-
10
-
11
-
 12
12 -
 13
13 -
 14
14 -
 15
15 -
 16
16 -
 17
17 -
 18
18 -
 19
19 -
 20
20 -
 21
21 -
 22
22 -
 23
23 -
 24
24 -
 25
25 -
 26
26
 |
 |
20
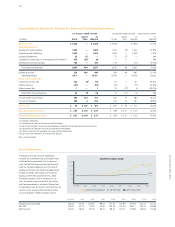
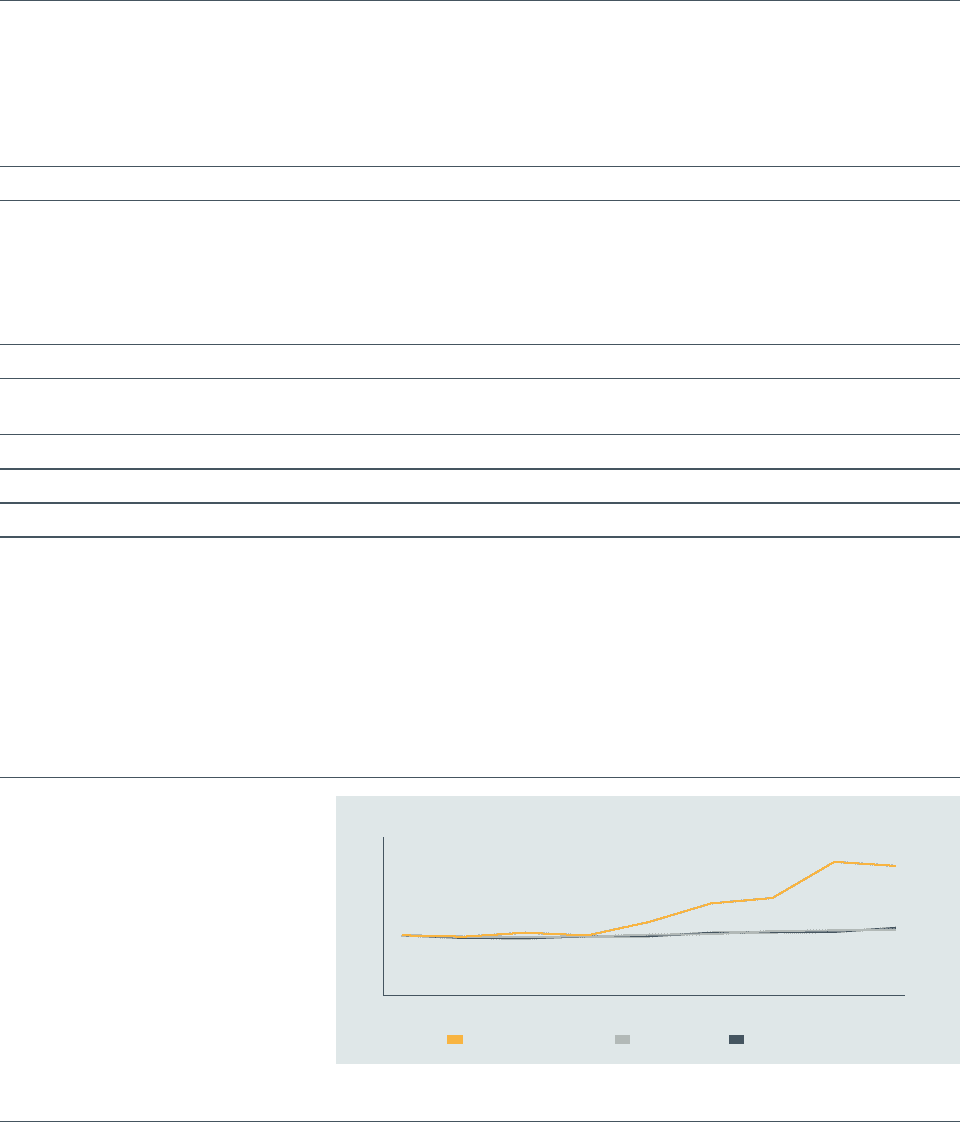
Stock Performance Graph
5/25/06
$250
200
150
100
50
0
$214
$110
$109
MasterCard Incorporated S&P 500 Index S&P Financial Index
5/06 6/06 7/06 8/06 9/06 10/06 11/06 12/06
Design: Sequel Studio, New York
Reconciliation to Net Income, Earnings Per Share and Total Operating Expenses
Stock Performance
The graph to the right and the table below
compare the cumulative total stockholder return
of MasterCard Incorporated Class A common
stock, the S&P 500 Index and the S&P Financial
Index for the period beginning on the close of
trading on the New York Stock Exchange (NYSE)
on May 25, 2006, and ending on the close of
trading on the NYSE on December 31, 2006.
The graph assumes a $100 investment in our
Class A common stock and each of the indices
and the reinvestment of dividends. MasterCard
Incorporated’s Class B common stock and Class M
common stock are not publicly traded or listed
on any exchange or dealer quotation system.
5/25/06 5/06 6/06 7/06 8/06 9/06 10/06 11/06 12/06
MasterCard Incorporated 100.00 97.70 104.35 99.72 121.52 152.93 161.29 221.47 214.37
S&P 500 100.00 97.12 97.25 97.85 100.18 102.76 106.11 108.13 109.65
S&P Financial 100.00 96.32 95.72 98.10 99.23 103.37 105.88 106.54 110.65
For the year ended 12/31/06 For the year ended 12/31/05 Year-Over-Year Growth
Special As Special As As
($ million) Actual Items Adjusted Actual Items Adjusted Adjusted
Revenues, Net $ 3,326 — $ 3,326 $ 2,938 — $ 2,938 13.2%
Operating Expenses
General and Administrative 1,505 — 1,505 1,352 193 1,333 12.9%
Advertising and Marketing 1,052 — 1,052 1,008 — 1,008 4.4%
Litigation Settlements 25 251 — 75 751 — NM
Charitable Contributions to The MasterCard Foundation 415 3954 202 — — — NM
Depreciation and Amortization 100 — 100 110 — 110 (9.1%)
Total Operating Expenses 3,097 420 2,677 2,545 94 2,451 9.2%
Operating Income 229 420 649 393 94 487 33.3%
Operating Margin 6.9% — 19.5% 13.4% — 16.6% 2.9 ppt
Other Income (expense)
Investment Income, Net 125 (7)5 118 61 — 61 93.4%
Interest Expense (61) — (61) (70) — (70) (12.9%)
Other Income, Net 1 — 1 23 (17)6 6 (83.3%)
Total Other Income (expense) 65 (7) 58 14 (17) (3) NM
Income before Income Taxes 294 413 707 407 77 484 46.1%
Income Tax Expense 244 6 250 140 27 167 49.9%
Net Income $ 50 $ 407 $ 457 $ 267 $ 50 $ 317 44.2%
Basic Net Income per Share $ 0.37 $ 3.00 $ 3.37 $ 1.98 $ 0.37 $ 2.35 43.4%
Diluted Net Income per Share $ 0.37 $ 3.00 $ 3.37 $ 1.98 $ 0.37 $ 2.35 43.4%
(1) Litigation settlements
(2) Contribution of cash to The MasterCard Foundation
(3) Adjustment to reflect accounting methodology change for cash-based executive incentive plans
(4) Contribution of common stock to The MasterCard Foundation
(5) Interest income on IPO proceeds that were used for redemption
(6) Gains from the settlement of a contractual dispute
NM = not meaningful