Marks and Spencer 2005 Annual Report Download - page 9
Download and view the complete annual report
Please find page 9 of the 2005 Marks and Spencer annual report below. You can navigate through the pages in the report by either clicking on the pages listed below, or by using the keyword search tool below to find specific information within the annual report.-
 1
1 -
 2
2 -
 3
3 -
 4
4 -
 5
5 -
 6
6 -
 7
7 -
 8
8 -
 9
9 -
 10
10 -
 11
11 -
 12
12 -
 13
13 -
 14
14 -
 15
15 -
 16
16 -
 17
17 -
 18
18 -
 19
19 -
 20
20 -
21
-
22
-
23
-
24
-
25
-
26
-
27
-
28
-
29
-
30
-
31
-
32
-
33
-
34
-
35
-
36
-
37
-
38
-
39
-
40
-
41
-
42
-
43
-
44
-
45
-
46
-
47
-
48
-
49
-
50
-
51
-
52
-
53
-
54
-
55
-
56
-
57
-
58
-
59
-
60
-
61
-
62
-
63
-
64
 |
 |

MARKS AND SPENCER GROUP PLC 7
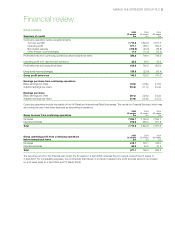
Balance sheet
2004
2005 Retail &
Group Corporate
£m £m
Fixed assets 3,447.5 3,493.4
Stocks 339.7 398.0
Trade and other debtors 218.2 202.9
Trade and other creditors (830.4) (895.7)
Provisions (80.4) (49.3)
Net debt (2,099.0) (823.7)
Net assets before net post-retirement liability 995.6 2,325.6
Net post-retirement liability (474.2) (469.5)
Net assets 521.4 1,856.1
Gearing % (including net post-retirement liability) 84.5% 44.7%
The Group balance sheet has changed significantly since the last year end following the disposal of the Financial Services business during
the year. The commentary that follows, where relevant, compares the Group balance sheet at 2 April 2005 to the Retail and Corporate
balance sheet at 3 April 2004, which excludes the balance sheet for the Financial Services businesses at that date.
Fixed assets decreased by £45.9m to £3,447.5m. Included within this are properties owned by the Group with a net book value of
£2.1bn, of which £1.7bn was unencumbered, and goodwill of £122.4m relating to the acquisition of per una.
In July 2004, the Group commissioned DTZ Debenham Tie Leung, an External Valuer, to carry out a valuation of the Group’s property
portfolio. This valuation was carried out on an existing use value basis for the Group’s operational stores and other properties and a
market value basis for non-operational properties. This gave rise to a valuation for the Group’s properties of approximately £3.6bn.
Adjusting this valuation for movements in the Group’s portfolio since that date gives rise to a surplus over net book value as at 2 April
2005 of approximately £1.3bn. Had this valuation been incorporated into the Group’s balance sheet as at 2 April 2005 then net assets
would have increased by £1.3bn to £1.8bn.
Stock at the end of the year was £339.7m, a decrease of £58.3m on the balance at the end of last year largely as a result of better
controls over stock and commitment.
Provisions for liabilities and charges increased by £31.1m largely as a result of a £30m reduction in the deferred tax asset attributable to
the £400m pension contribution last year. The net post-retirement liability remained broadly level with the previous year.
Shareholders’ funds amounted to £521.4m, equivalent to 31.4p per share (last year 108.3p per share), a decrease of £1,932.6m in the
year primarily due to the £2.3bn Tender Offer. If the recent property valuation is included, Group gearing would have been 61.8% and
return on equity 22.0%.
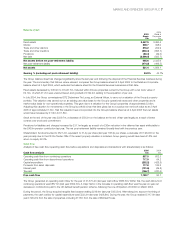
Cash flow
Analysis of free cash flow (operating cash flow before acquisitions and disposals and transactions with shareholders) is as follows:
2005 2004
Cash flow analysis £m £m
Operating cash flow from continuing operations 857.5 602.3
Operating cash flow from discontinued operations 717.9 64.2
Capital expenditure (232.2) (428.8)
Proceeds from asset disposals 117.8 126.2
Interest paid (101.6) (49.8)
Tax paid (166.7) (220.4)
Free cash flow 1,192.7 93.7
The Group generated an operating cash inflow for the year of £1,575.4m (last year cash inflow £666.5m). Within this, the cash inflow from
continuing operations was £857.5m (last year £602.3m). A major factor in the increase in operating cash flow was the year-on-year net
decrease in contributions paid to the UK defined benefit pension scheme, following the one-off injection of £400m in March 2004.
During the period, the Group acquired tangible fixed assets totalling £219.6m (last year £433.5m). After taking into account the timing of
payments, the cash outflow for capital expenditure was £232.2m (last year £428.8m). During the year, the Group received £117.8m (last
year £126.2m) from the sale of properties, including £115m from the sale of Michael House.