Marks and Spencer 2005 Annual Report Download - page 6
Download and view the complete annual report
Please find page 6 of the 2005 Marks and Spencer annual report below. You can navigate through the pages in the report by either clicking on the pages listed below, or by using the keyword search tool below to find specific information within the annual report.-
 1
1 -
 2
2 -
 3
3 -
 4
4 -
 5
5 -
 6
6 -
 7
7 -
 8
8 -
 9
9 -
 10
10 -
 11
11 -
 12
12 -
 13
13 -
 14
14 -
 15
15 -
 16
16 -
 17
17 -
18
-
19
-
20
-
21
-
22
-
23
-
24
-
25
-
26
-
27
-
28
-
29
-
30
-
31
-
32
-
33
-
34
-
35
-
36
-
37
-
38
-
39
-
40
-
41
-
42
-
43
-
44
-
45
-
46
-
47
-
48
-
49
-
50
-
51
-
52
-
53
-
54
-
55
-
56
-
57
-
58
-
59
-
60
-
61
-
62
-
63
-
64
 |
 |

4MARKS AND SPENCER GROUP PLC
Financial review continued
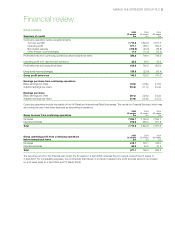
UK Retail
2005 2004
52 weeks 52 weeks
Turnover (£m) 7,034.7 7,159.8
Operating profit (before exceptional items) (£m) 612.1 722.1
Number of stores (at the end of the year) 399 375
Selling space at the end of the year (m sq ft) 12.9 12.8
Turnover, including VAT, was down 1.9% on last year, down 5.1% on a like-for-like basis.
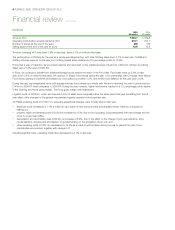
The performance of Clothing for the year as a whole was disappointing, with total Clothing sales down 3.1% on last year. Footfall and
clothing volumes were up on the year, but Clothing market share declined by 0.5 percentage points to 10.5%.
Home had a year of transition, as we closed Lifestore and refocused on the traditional areas of bedroom, bathroom, kitchen and dining.
Sales were 21.4% lower at £407.6m.
In Food, we continue to benefit from additional footage as we extend the reach of the Food offer. Food sales were up 2.4% on last
year, down 2.6% on a like-for-like basis. We opened 31 Simply Food stores during the year, 13 in partnership with Compass. New Simply
Food stores opening in 2005/06 will increase our food space by a further 3.3%. Like-for-like food deflation for the year was c.0.2%.
During the year, we renegotiated terms with suppliers across the business as a whole with the aim of reducing the cost of goods sold by
£140m by 2006/07 when compared to 2003/04. During the year, however, higher markdowns resulted in a 1.5 percentage points decline
in the Clothing and Home gross margin. The Food gross margin was maintained.
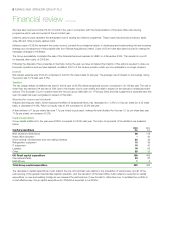
Logistics costs of £305.5m, which are included in cost of sales, were marginally below the same period last year benefiting from the full
year effect of the changes to the general merchandise logistics operation introduced last year.
UK Retail operating costs of £1,843.1m, excluding exceptional charges, were broadly level on last year:
•employee costs increased by 1.1% to £922.4m as a result of new stores and the annual salary review, offset by a reduction in
headcount;
•property, repair and renewal costs of £350.4m increased by 8.3% due to the occupancy costs associated with new footage and the
move to a new head office;
•depreciation and amortisation was £242.9m, an increase of 6.9%, due to the effect on the charge of prior year additions, store
modernisations, closures and amortisation of goodwill arising on the acquisition of per una; and
•other operating costs of £327.4m decreased by 13.2% as a result of actions taken during the year to reduce the cost of non-
merchandise procurement together with savings in IT.
Including logistics costs, operating costs have decreased by 0.1% on last year.