Kohl's 2008 Annual Report Download - page 45
Download and view the complete annual report
Please find page 45 of the 2008 Kohl's annual report below. You can navigate through the pages in the report by either clicking on the pages listed below, or by using the keyword search tool below to find specific information within the annual report.-
 1
1 -
2
-
3
-
4
-
5
-
6
-
7
-
8
-
9
-
10
-
11
-
12
-
13
-
14
-
15
-
16
-
17
-
18
-
19
-
20
-
21
-
22
-
23
-
24
-
25
-
26
-
27
-
28
-
29
-
30
-
31
-
32
-
33
-
34
-
 35
35 -
 36
36 -
 37
37 -
 38
38 -
 39
39 -
 40
40 -
 41
41 -
 42
42 -
 43
43 -
 44
44 -
 45
45 -
 46
46 -
 47
47 -
 48
48 -
 49
49 -
 50
50 -
 51
51 -
 52
52 -
 53
53 -
 54
54 -
 55
55 -
56
-
57
-
58
-
59
-
60
-
61
-
62
-
63
-
64
-
65
-
66
-
67
-
68
-
69
-
70
-
71
-
72
-
73
-
74
-
75
-
76
-
77
-
78
-
79
-
80
-
81
 |
 |

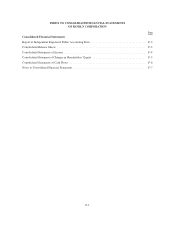
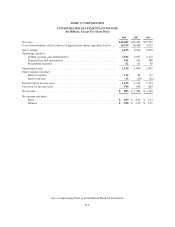
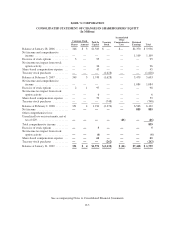
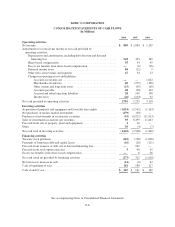
KOHL’S CORPORATION
CONSOLIDATED STATEMENTS OF CASH FLOWS
(In Millions)
2008 2007 2006
Operating activities
Net income ........................................................ $ 885 $ 1,084 $ 1,109
Adjustments to reconcile net income to net cash provided by
operating activities:
Depreciation and amortization, including debt discount and deferred
financing fees ................................................ 543 453 389
Share-based compensation ........................................ 55 54 45
Excess tax benefits from share-based compensation .................... —(6) (26)
Deferred income taxes ........................................... 84 (12) 9
Other non-cash revenues and expenses .............................. 47 34 23
Changes in operating assets and liabilities:
Accounts receivable, net ..................................... —— 1,652
Merchandise inventories ..................................... 60 (275) (350)
Other current and long-term assets ............................. (23) (45) (65)
Accounts payable ........................................... 48 (98) 104
Accrued and other long-term liabilities .......................... 28 149 138
Income taxes ............................................... (26) (103) 92
Net cash provided by operating activities ................................ 1,701 1,235 3,120
Investing activities
Acquisition of property and equipment and favorable lease rights ............. (1,014) (1,542) (1,163)
Net purchases of money-market investments ............................. (479) (30) —
Purchases of investments in auction rate securities ......................... (53) (6,521) (11,913)
Sales of investments in auction rate securities ............................. 93 6,499 11,643
Proceeds from sale of property, plant and equipment ....................... 130 —
Other ............................................................. 10 (4) (7)
Net cash used in investing activities .................................... (1,442) (1,568) (1,440)
Financing activities
Treasury stock purchases ............................................. (262) (748) (1,628)
Payments of long-term debt and capital leases ............................ (16) (20) (111)
Proceeds from issuance of debt, net of deferred financing fees ................ —989 —
Proceeds from stock option exercises ................................... 598 95
Excess tax benefits from share-based compensation ........................ —626
Net cash (used in) provided by financing activities ......................... (273) 325 (1,618)
Net (decrease) increase in cash ........................................ (14) (8) 62
Cash at beginning of year ............................................. 181 189 127
Cash at end of year .................................................. $ 167 $ 181 $ 189
See accompanying Notes to Consolidated Financial Statements
F-6