Kohl's 2008 Annual Report Download - page 12
Download and view the complete annual report
Please find page 12 of the 2008 Kohl's annual report below. You can navigate through the pages in the report by either clicking on the pages listed below, or by using the keyword search tool below to find specific information within the annual report.-
 1
1 -
 2
2 -
 3
3 -
 4
4 -
 5
5 -
 6
6 -
 7
7 -
 8
8 -
 9
9 -
 10
10 -
 11
11 -
 12
12 -
 13
13 -
 14
14 -
 15
15 -
 16
16 -
 17
17 -
 18
18 -
 19
19 -
 20
20 -
 21
21 -
 22
22 -
23
-
24
-
25
-
26
-
27
-
28
-
29
-
30
-
31
-
32
-
33
-
34
-
35
-
36
-
37
-
38
-
39
-
40
-
41
-
42
-
43
-
44
-
45
-
46
-
47
-
48
-
49
-
50
-
51
-
52
-
53
-
54
-
55
-
56
-
57
-
58
-
59
-
60
-
61
-
62
-
63
-
64
-
65
-
66
-
67
-
68
-
69
-
70
-
71
-
72
-
73
-
74
-
75
-
76
-
77
-
78
-
79
-
80
-
81
 |
 |

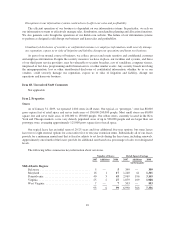
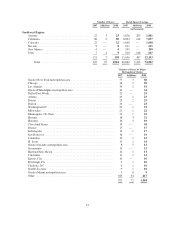
Number of Stores Retail Square Footage
2007 Additions 2008 2007 Additions 2008
(in thousands)
Southwest Region:
Arizona .................................... 22 3 25 1,676 205 1,881
California ................................... 88 2 90 6,893 144 7,037
Colorado ................................... 22 — 22 1,698 — 1,698
Nevada ..................................... 8 — 8611 — 611
New Mexico ................................ 4 — 4249 — 249
Utah ....................................... 7 2 9529 138 667
151 7 158 11,656 487 12,143
Total .................................. 929 75 1,004 69,889 5,103 74,992
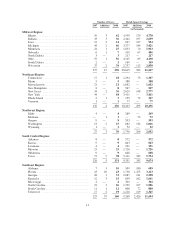
Number of Stores by Major
Metropolitan Market
2007 Additions 2008
Greater New York metropolitan area .............................. 57 3 60
Chicago ..................................................... 48 2 50
Los Angeles ................................................. 39 2 41
Greater Philadelphia metropolitan area ............................ 34 — 34
Dallas/Fort Worth ............................................. 25 — 25
Atlanta ..................................................... 23 2 25
Detroit ...................................................... 23 2 25
Boston ...................................................... 23 — 23
Washington DC .............................................. 22 1 23
Milwaukee .................................................. 21 1 22
Minneapolis / St. Paul .......................................... 21 1 22
Phoenix ..................................................... 18 3 21
Houston ..................................................... 16 3 19
Cleveland/Akron .............................................. 18 — 18
Denver ..................................................... 17 — 17
Indianapolis ................................................. 16 1 17
San Francisco ................................................ 16 — 16
Columbus ................................................... 14 1 15
St. Louis .................................................... 13 1 14
Greater Orlando metropolitan area ................................ 8 5 13
Sacramento .................................................. 13 — 13
Hartford/New Haven .......................................... 12 1 13
Cincinnati ................................................... 11 1 12
Kansas City .................................................. 10 — 10
Pittsburgh, PA ................................................ 9 1 10
Charlotte, NC ................................................ 9 1 10
Seattle-Tacoma ............................................... 9 1 10
Greater Miami metropolitan area ................................. 1 8 9
Other ....................................................... 383 34 417
929 75 1,004
12