Kia 2001 Annual Report Download - page 2
Download and view the complete annual report
Please find page 2 of the 2001 Kia annual report below. You can navigate through the pages in the report by either clicking on the pages listed below, or by using the keyword search tool below to find specific information within the annual report.-
 1
1 -
 2
2 -
 3
3 -
 4
4 -
 5
5 -
 6
6 -
 7
7 -
 8
8 -
 9
9 -
 10
10 -
 11
11 -
 12
12 -
 13
13 -
14
-
15
-
16
-
17
-
18
-
19
-
20
-
21
-
22
-
23
-
24
-
25
-
26
-
27
-
28
-
29
-
30
-
31
-
32
-
33
-
34
-
35
-
36
-
37
 |
 |

contents
01.
Financial Highlights
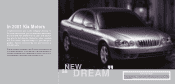
03.
Setting the Goals
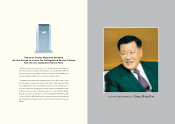
06.
Message from the President & CEO
09.
Setting the Standard
10.
Domestic Business Activities
12.
Overseas Business Activities
14.
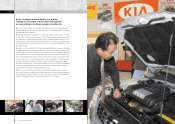
After-sales Service
16.
Production & Quality
19.
Setting the Pace
20.
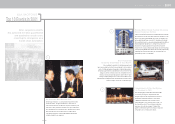
Top 10 Events
24.
Operational Report
33.
Auditor's Report
34.
Report of Independent Public Accountants
36.
Financial Statements & Notes
68.
Kia Motors' Major Export Lineup
70.
Corporate History
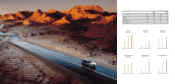
Sales
Net Income
Total Assets
Shareholders' Equity
Earnings Per Share (, US)
Return On Equity (%)
Area
10,806
331
8,169
3,062
743
10.7
2000
12,356
552
8,438
3,393
1,424
17.1
Korea Won
in Billions U.S. Dollars
in Millions
2001
7,931
136
7,681
3,097
493
4.4
1999
9,318
416
6,363
2,559
1.07
17.1
For the ended December 31,2001, 2000 and 1999
2001
Financial Highlights
1999 2000 2001
Earnings Per Share
(Korean Won, U.S. Dollars)
493
743
1,424
1.07
1999 2000 2001
Return On Equity(%)
4.4
10.7
17.1
1999 2000 2001
Sales
(Korean Won in Billions,
U.S. Dollars in Millions)
7,931
10,806
12,356
9,318
1999 2000 2001
Net Income
(Korean Won in Billions,
U.S. Dollars in Millions)
136
331
552
416
1999 2000 2001
Total Assets
(Korean Won in Billions,
U.S. Dollars in Millions)
7,681 8,169
8,438
6,363
1999 2000 2001
Shareholders' Equity
(Korean Won in Billions,
U.S. Dollars in Millions)
3,097 3,062
3,393
2,559