Johnson and Johnson 2011 Annual Report Download - page 4
Download and view the complete annual report
Please find page 4 of the 2011 Johnson and Johnson annual report below. You can navigate through the pages in the report by either clicking on the pages listed below, or by using the keyword search tool below to find specific information within the annual report.-
 1
1 -
 2
2 -
 3
3 -
 4
4 -
 5
5 -
 6
6 -
 7
7 -
 8
8 -
 9
9 -
 10
10 -
 11
11 -
 12
12 -
 13
13 -
 14
14 -
 15
15 -
16
-
17
-
18
-
19
-
20
-
21
-
22
-
23
-
24
-
25
-
26
-
27
-
28
-
29
-
30
-
31
-
32
-
33
-
34
-
35
-
36
-
37
-
38
-
39
-
40
-
41
-
42
-
43
-
44
-
45
-
46
-
47
-
48
-
49
-
50
-
51
-
52
-
53
-
54
-
55
-
56
-
57
-
58
-
59
-
60
-
61
-
62
-
63
-
64
-
65
-
66
-
67
-
68
-
69
-
70
-
71
-
72
-
73
-
74
-
75
-
76
 |
 |

JOHNSON & JOHNSON 2011 ANNUAL REPORT2
of Synthes, Inc. in the MD&D business.
When I look back at how we faced this period of industry and
global change, and how we have managed, I am proud of the
people of Johnson & Johnson. They have shown the ingenuity,
resiliency, tenacity, integrity and compassion that you would
expect of a global leader in human health care.
2011 RESULTS
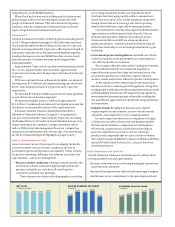
Johnson & Johnson returned to delivering operational sales growth
in 2011. We grew adjusted earnings1 for the 28th consecutive year.
Our worldwide sales were $65.0 billion, an increase of 5.6 percent.
Sales increased operationally 2.8 percent, reflecting the strength of
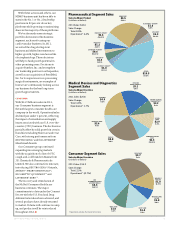
new product launches in our Pharmaceuticals business segment,
steady performance across our MD&D franchise, science-based
innovations in our Consumer business and strong growth in
emerging markets.
Approximately 70 percent of our sales were from products with
No. 1 or No. 2 global market share positions. Approximately
25 percent of our sales were from products introduced in the past
five years.
With our continued focus on financial discipline, our adjusted
earnings were $13.9 billion1 and adjusted earnings per share were
$5.001, representing increases of 4.4 percent and 5.0 percent,
respectively.
We invested $7.5 billion in R&D and advanced robust pipelines
across all three of our business segments.
We generated significant free cash flow of approximately
$11.4 billion2, maintained our AAA credit rating and increased the
dividend to our shareholders for the 49th consecutive year.
Solid and consistent returns to shareholders have been a
hallmark of Johnson & Johnson. During 2011, we generated a
one-year total shareholder return of nearly 10 percent, exceeding
the Standard & Poor’s 500 and Dow Jones Industrial Average. Over
longer timeframes, we continue to compare favorably to those
indices. With a long-term management focus, our company has
remained a solid investment choice for decades. (For more details,
see the 2011 Business Segment Highlights on pages 4 and 5.)
FORCES SHAPING HEALTH CARE
As we look ahead, we see three major forces shaping the health
care environment: macroeconomic conditions, the role of
government payers and regulators, and industry trends. Clearly,
each poses continuing challenges. But inherent in each are also
opportunities … and we are seizing them.
• Macroeconomic conditions: Slowing economic growth, the
uncertainty in financial markets, high unemployment and
pressure on health care costs have all contributed to
constraints on health care spending.
These dynamics are balanced by demographic trends that
are creating demand for health care. Populations in the
developed world are aging rapidly, and we consume more
health care as we grow older. Global expansion and growth,
though slower than a few years ago, also lead to growing
demand for health care, especially in emerging markets.
Our investments continue to be aligned with these market
opportunities to address unmet medical needs. Cancers,
mental health disorders, diabetes, heart disease, stroke,
rheumatoid arthritis and HIV are all among the most
significant diseases—and they are markets where today we
either have leadership or are increasing investments to gain
leadership.
• Government payers and regulators: As health care reform
evolves around the world, governments are requiring more
cost-effective health care solutions.
We recognize these priorities and are making investments
in personalized medicine and companion diagnostics,
especially in the areas of oncology and anti-psychotics, that
are geared toward how we can better target treatments,
monitor results and be more efficient in product development.
As the regulatory environment has become much more
intense, we share a common goal with regulators: saving lives,
easing people’s suffering and addressing unmet medical needs
with meaningful innovations. We support strong regulatory
environments that ensure patient safety while enabling the
fast and efficient approval of potentially life-saving medicines
and treatments.
• Industry trends: Bringing new innovations to market
requires significant investments, access to the best minds
and talent, and adaptability to ever-changing markets.
It is more important than ever for companies to be agile,
collaborative and able to thrive with new business models.
We have always looked to complement our development
efforts with acquisitions and collaborations that help us
gain new capabilities or provide access to technology,
products and compounds that we can accelerate to market.
The collaborations in Alzheimer’s disease with Elan and Pfizer,
and in HIV with Gilead Sciences, Inc., are just a few of our
promising ventures.
WELL POSITIONED FOR GROWTH
Overall, Johnson & Johnson is well positioned to address these
evolving market forces and opportunities:
• Because of the ways we are delivering meaningful innovations
to patients and customers;
• Because of the steps we have taken to build a more agile company;
• And because of our commitment to the operating model and
$61.9
NET S ALES
(in billions of dollars)
2009 20102007 2 0 0 9 2 0102007
$4.40
$3.63
$4.78
D I L U T ED EARNI N G S PER SHARE
(in dollars)
2 0 0 9 20102007
$1.620
$61.1 $61.6
201 1
$65.0
$63.7
2008 2 0 0 8
$4.57
2011
$3.49
$1.930
2 0 0 8
$1.795
$2.110
201 1
$2.250
DIVIDENDS PA I D PER SHARE
(in dollars)