JP Morgan Chase 2008 Annual Report Download - page 6
Download and view the complete annual report
Please find page 6 of the 2008 JP Morgan Chase annual report below. You can navigate through the pages in the report by either clicking on the pages listed below, or by using the keyword search tool below to find specific information within the annual report.-
 1
1 -
 2
2 -
 3
3 -
 4
4 -
 5
5 -
 6
6 -
 7
7 -
 8
8 -
 9
9 -
 10
10 -
 11
11 -
 12
12 -
 13
13 -
 14
14 -
 15
15 -
 16
16 -
 17
17 -
18
-
19
-
20
-
21
-
22
-
23
-
24
-
25
-
26
-
27
-
28
-
29
-
30
-
31
-
32
-
33
-
34
-
35
-
36
-
37
-
38
-
39
-
40
-
41
-
42
-
43
-
44
-
45
-
46
-
47
-
48
-
49
-
50
-
51
-
52
-
53
-
54
-
55
-
56
-
57
-
58
-
59
-
60
-
61
-
62
-
63
-
64
-
65
-
66
-
67
-
68
-
69
-
70
-
71
-
72
-
73
-
74
-
75
-
76
-
77
-
78
-
79
-
80
-
81
-
82
-
83
-
84
-
85
-
86
-
87
-
88
-
89
-
90
-
91
-
92
-
93
-
94
-
95
-
96
-
97
-
98
-
99
-
100
-
101
-
102
-
103
-
104
-
105
-
106
-
107
-
108
-
109
-
110
-
111
-
112
-
113
-
114
-
115
-
116
-
117
-
118
-
119
-
120
-
121
-
122
-
123
-
124
-
125
-
126
-
127
-
128
-
129
-
130
-
131
-
132
-
133
-
134
-
135
-
136
-
137
-
138
-
139
-
140
-
141
-
142
-
143
-
144
-
145
-
146
-
147
-
148
-
149
-
150
-
151
-
152
-
153
-
154
-
155
-
156
-
157
-
158
-
159
-
160
-
161
-
162
-
163
-
164
-
165
-
166
-
167
-
168
-
169
-
170
-
171
-
172
-
173
-
174
-
175
-
176
-
177
-
178
-
179
-
180
-
181
-
182
-
183
-
184
-
185
-
186
-
187
-
188
-
189
-
190
-
191
-
192
-
193
-
194
-
195
-
196
-
197
-
198
-
199
-
200
-
201
-
202
-
203
-
204
-
205
-
206
-
207
-
208
-
209
-
210
-
211
-
212
-
213
-
214
-
215
-
216
-
217
-
218
-
219
-
220
-
221
-
222
-
223
-
224
-
225
-
226
-
227
-
228
-
229
-
230
-
231
-
232
-
233
-
234
-
235
-
236
-
237
-
238
-
239
-
240
 |
 |
As we move into 2009, we are not resting on our
laurels. We know we operate in a risky business with
many tough competitors who inevitably will come
back strong – even if some currently are distracted.
We also know that the investment banking business,
in many ways, will never be the same. Leverage will be
lower, and certain structured financial products will
likely cease to exist. But the fundamental business will
remain the same: advising corporations and investors,
raising capital, executing trades, providing research,
making markets, and giving our clients the best ideas
and the financing to make those plans a reality.
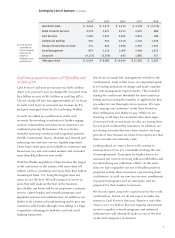
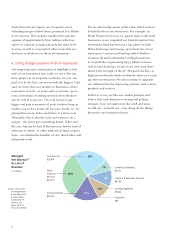
Retail Financial Services reported net income of
$880 million with an ROE of 5%
With $880 million in earnings, Retail Financial
Services (RFS) had a poor year overall. For its two
primary businesses – Retail Banking and Consumer
Lending – it was a tale of two cities.
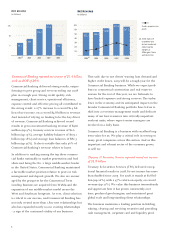
On the plus side, Retail Banking, which includes
Consumer Banking and Business Banking, earned
$3 billion and, more important, grew its franchise –
both organically and through the acquisition of
Washington Mutual. We expect the WaMu acquisition
to contribute more than $2 billion in annual earnings,
and it has extended our branch network to more than
5,000 branches in 23 states, adding 7,200 bankers and
increasing our ATMs to 14,500, the second-largest ATM
network nationally. In Retail Banking, since the Bank
One merger and the addition of The Bank of New York
and WaMu branch networks, we have exponentially
grown our footprint, adding 4,400 branches through
acquisition and 500 organically. This five-year expan-
sion is reflected in more checking accounts (from 2.3
million to 24 million), more deposits (from $89 billion
to $342 billion) and more states in which we operate
(from four to 23).
On the negative side, Consumer Lending, which
includes the Mortgage, Home Equity, Student Loan
and Auto Finance businesses, reported a loss of $2.1
billion, driven by a 274% increase, to $9.5 billion, in
the provision for credit losses, primarily in the home
lending businesses. Despite these losses, Consumer
Lending remains core to what we do. It enables us
to serve customers across many products and extend
$352 billion in loans. However, continued pressure
on home prices, the effects of past poor underwriting
standards and the deepening recession have pushed
up, and, unfortunately, will continue to push up, credit
costs. Our current expectation is that quarterly charge-
offs for the Mortgage and Home Equity portfolios
could range from $1.8 billion to $2.4 billion (an
extremely high annualized loss rate of 3.5% to 5%).
By the end of 2008, we had reserves of more than $8
billion across all of RFS, and, with the expectation of
higher charge-offs, we also expect to build additional
reserves in 2009. However, there is one area that has
shown an improving trend: third-party mortgage
servicing. This business relies on scale and efficiency
and, including the addition of the WaMu portfolio,
it grew 91% to $1.17 trillion of loans.
We believe we have corrected for the underwriting
mistakes of the past. Essentially, by the end of 2008,
we saw a return to old-fashioned home lending stan-
dards (a maximum of 80% loan-to-value, with fully
documented income). In addition, we closed down all
business originated by mortgage brokers. My worst
mistake of the past several years was not doing this
sooner. In general, the credit losses in the broker-
originated business are two to three times worse
than that of our own directly originated business.
Unfortunately, approximately 30% of our home loans
were originated through the broker channel. Although
we will be paying for this bad underwriting for years
to come, we will continue to build the Consumer
Lending business with new standards in place.
We have always loved the Retail Banking business and
believe that the exceptional economics of the branch-
based businesses will fuel growth and earn a return on
equity (ROE) of more than 30% over time. As for the
Consumer Lending business, it should produce returns
of 15%-20%, especially as we capitalize on the benefits
of cross-selling and cross-underwriting.
4