JP Morgan Chase 2008 Annual Report Download - page 10
Download and view the complete annual report
Please find page 10 of the 2008 JP Morgan Chase annual report below. You can navigate through the pages in the report by either clicking on the pages listed below, or by using the keyword search tool below to find specific information within the annual report.-
 1
1 -
 2
2 -
 3
3 -
 4
4 -
 5
5 -
 6
6 -
 7
7 -
 8
8 -
 9
9 -
 10
10 -
 11
11 -
 12
12 -
 13
13 -
 14
14 -
 15
15 -
 16
16 -
 17
17 -
 18
18 -
 19
19 -
 20
20 -
 21
21 -
22
-
23
-
24
-
25
-
26
-
27
-
28
-
29
-
30
-
31
-
32
-
33
-
34
-
35
-
36
-
37
-
38
-
39
-
40
-
41
-
42
-
43
-
44
-
45
-
46
-
47
-
48
-
49
-
50
-
51
-
52
-
53
-
54
-
55
-
56
-
57
-
58
-
59
-
60
-
61
-
62
-
63
-
64
-
65
-
66
-
67
-
68
-
69
-
70
-
71
-
72
-
73
-
74
-
75
-
76
-
77
-
78
-
79
-
80
-
81
-
82
-
83
-
84
-
85
-
86
-
87
-
88
-
89
-
90
-
91
-
92
-
93
-
94
-
95
-
96
-
97
-
98
-
99
-
100
-
101
-
102
-
103
-
104
-
105
-
106
-
107
-
108
-
109
-
110
-
111
-
112
-
113
-
114
-
115
-
116
-
117
-
118
-
119
-
120
-
121
-
122
-
123
-
124
-
125
-
126
-
127
-
128
-
129
-
130
-
131
-
132
-
133
-
134
-
135
-
136
-
137
-
138
-
139
-
140
-
141
-
142
-
143
-
144
-
145
-
146
-
147
-
148
-
149
-
150
-
151
-
152
-
153
-
154
-
155
-
156
-
157
-
158
-
159
-
160
-
161
-
162
-
163
-
164
-
165
-
166
-
167
-
168
-
169
-
170
-
171
-
172
-
173
-
174
-
175
-
176
-
177
-
178
-
179
-
180
-
181
-
182
-
183
-
184
-
185
-
186
-
187
-
188
-
189
-
190
-
191
-
192
-
193
-
194
-
195
-
196
-
197
-
198
-
199
-
200
-
201
-
202
-
203
-
204
-
205
-
206
-
207
-
208
-
209
-
210
-
211
-
212
-
213
-
214
-
215
-
216
-
217
-
218
-
219
-
220
-
221
-
222
-
223
-
224
-
225
-
226
-
227
-
228
-
229
-
230
-
231
-
232
-
233
-
234
-
235
-
236
-
237
-
238
-
239
-
240
 |
 |

8
Aside from Private Equity, our Corporate sector,
excluding merger-related items, produced $1.5 billion
in net income. This includes unallocated corporate
expense of approximately $500 million, which we
expect to continue at approximately the same level
in 2009, as well as a myriad of other items that are
disclosed in detail in our financial statements.
B. Strong strategic positions of all our businesses
One important and critical point to highlight is that
each of our businesses now ranks as one of the top
three players in its respective industry. As ever, our
goal is to be the best, not necessarily the biggest. That
said, we know that size matters in businesses where
economies of scale – in areas such as systems, opera-
tions, innovation, branding and risk diversification –
can be critical to success. The only reason to get
bigger and gain economies of scale is when doing so
enables you to do a better job for your clients; i.e., by
giving them more, better and faster at a lower cost.
Ultimately, this is also the only real reason to do a
merger – the client gets something better. If this isn’t
the case, big can be bad. If bureaucracy, hubris, lack of
attention to detail – or other ailments of large corpora-
tions – overwhelm the benefits of size, then failure will
ultimately result.
We are also keenly aware of the value added at more
detailed levels in our businesses. For example, in
Retail Financial Services, we gained share with small
businesses as we expanded our brand footprint. Our
Investment Bank has become a top player in both
Prime Brokerage and Energy, previously two of our
weak spots. Commercial Banking added WaMu’s
Commercial and Community Lending businesses
to its portfolio, representing $44.5 billion in loans.
And Private Banking’s record in net new asset flows
showed the strength of the J.P. Morgan franchise, as
high-net-worth individuals worldwide chose us to man-
age their investments. We also continue to upgrade
our infrastructure by improving systems, data centers,
products and services.
Suffice it to say, we like our market position and
believe that each business is strong and getting
stronger. Even in tough years like 2008 and 2009,
we did not – and will not – stop doing all the things
that make our businesses better.
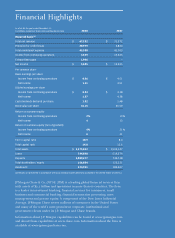
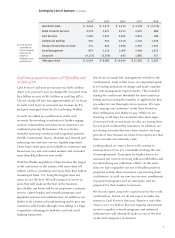
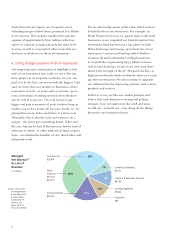
Managed
Net Revenue(a)
by Line of
Business
(in millions)
Commercial Banking
$4,777
Investment Bank
$12,214
Retail
Financial
Services
$23,520
Asset Management
$7,584
Card Services
$16,474
Treasury & Securities Services
$8,134
17%
32%
23%
7%
11%
10%
Ass
Corporate
$69
(a) For a discussion
of managed basis
presentation and
a reconciliation
to reported net
revenue, see
pages 50-51 of
this Annual Report.