Intel 2012 Annual Report Download - page 55
Download and view the complete annual report
Please find page 55 of the 2012 Intel annual report below. You can navigate through the pages in the report by either clicking on the pages listed below, or by using the keyword search tool below to find specific information within the annual report.-
 1
1 -
2
-
3
-
4
-
5
-
6
-
7
-
8
-
9
-
10
-
11
-
12
-
13
-
14
-
15
-
16
-
17
-
18
-
19
-
20
-
21
-
22
-
23
-
24
-
25
-
26
-
27
-
28
-
29
-
30
-
31
-
32
-
33
-
34
-
35
-
36
-
37
-
38
-
39
-
40
-
41
-
42
-
43
-
44
-
 45
45 -
 46
46 -
 47
47 -
 48
48 -
 49
49 -
 50
50 -
 51
51 -
 52
52 -
 53
53 -
 54
54 -
 55
55 -
 56
56 -
 57
57 -
 58
58 -
 59
59 -
 60
60 -
 61
61 -
 62
62 -
 63
63 -
 64
64 -
 65
65 -
66
-
67
-
68
-
69
-
70
-
71
-
72
-
73
-
74
-
75
-
76
-
77
-
78
-
79
-
80
-
81
-
82
-
83
-
84
-
85
-
86
-
87
-
88
-
89
-
90
-
91
-
92
-
93
-
94
-
95
-
96
-
97
-
98
-
99
-
100
-
101
-
102
-
103
-
104
-
105
-
106
-
107
-
108
-
109
-
110
-
111
-
112
-
113
-
114
-
115
-
116
-
117
-
118
-
119
-
120
-
121
-
122
-
123
-
124
-
125
-
126
 |
 |

49
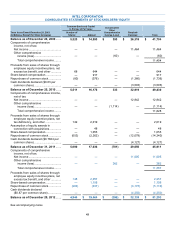
INTEL CORPORATION
CONSOLIDATED STATEMENTS OF STOCKHOLDERS’ EQUITY
Common Stock and Capital
in Excess of Par Value
Three Years Ended December 29, 2012
(In Millions, Except Per Share Amounts)
Number of
Shares
Amount
Accumulated
Other
Comprehensive
Income (Loss)
Retained
Earnings
Total
Balance as of December 26, 2009..............
5,523
$ 14,993
$ 393
$ 26,318
$ 41,704
Components of comprehensive
income, net of tax:
Net income ................................................
—
—
—
11,464
11,464
Other comprehensive
income (loss).........................................
—
—
(60)
—
(60)
Total comprehensive income................
11,404
Proceeds from sales of shares through
employee equity incentive plans, net
excess tax benefit, and other ....................
68
644
—
—
644
Share-based compensation...........................
—
917
—
—
917
Repurchase of common stock .......................
(80)
(376)
—
(1,360)
(1,736)
Cash dividends declared ($0.63 per
common share) .........................................
—
—
—
(3,503)
(3,503)
Balance as of December 25, 2010..............
5,511
16,178
333
32,919
49,430
Components of comprehensive income,
net of tax:
Net income ................................................
—
—
—
12,942
12,942
Other comprehensive
income (loss).........................................
—
—
(1,114)
—
(1,114)
Total comprehensive income................
11,828
Proceeds from sales of shares through
employee equity incentive plans, net
tax deficiency, and other ...........................
142
2,019
—
—
2,019
Assumption of equity awards in
connection with acquisitions......................
—
48
—
—
48
Share-based compensation...........................
—
1,053
—
—
1,053
Repurchase of common stock .......................
(653)
(2,262)
—
(12,078)
(14,340)
Cash dividends declared ($0.7824 per
common share) .........................................
—
—
—
(4,127)
(4,127)
Balance as of December 31, 2011..............
5,000
17,036
(781)
29,656
45,911
Components of comprehensive
income, net of tax:
Net income ................................................
—
—
—
11,005
11,005
Other comprehensive
income (loss).........................................
—
—
382
—
382
Total comprehensive income................
11,387
Proceeds from sales of shares through
employee equity incentive plans, net
excess tax benefit, and other ....................
148
2,257
—
—
2,257
Share-based compensation...........................
—
1,108
—
—
1,108
Repurchase of common stock .......................
(204)
(937)
—
(4,173)
(5,110)
Cash dividends declared
($0.87 per common share)........................
—
—
—
(4,350)
(4,350)
Balance as of December 29, 2012..............
4,944
$ 19,464
$ (399)
$ 32,138
$ 51,203
See accompanying notes.