Intel 2012 Annual Report Download - page 101
Download and view the complete annual report
Please find page 101 of the 2012 Intel annual report below. You can navigate through the pages in the report by either clicking on the pages listed below, or by using the keyword search tool below to find specific information within the annual report.-
 1
1 -
2
-
3
-
4
-
5
-
6
-
7
-
8
-
9
-
10
-
11
-
12
-
13
-
14
-
15
-
16
-
17
-
18
-
19
-
20
-
21
-
22
-
23
-
24
-
25
-
26
-
27
-
28
-
29
-
30
-
31
-
32
-
33
-
34
-
35
-
36
-
37
-
38
-
39
-
40
-
41
-
42
-
43
-
44
-
45
-
46
-
47
-
48
-
49
-
50
-
51
-
52
-
53
-
54
-
55
-
56
-
57
-
58
-
59
-
60
-
61
-
62
-
63
-
64
-
65
-
66
-
67
-
68
-
69
-
70
-
71
-
72
-
73
-
74
-
75
-
76
-
77
-
78
-
79
-
80
-
81
-
82
-
83
-
84
-
85
-
86
-
87
-
88
-
89
-
90
-
 91
91 -
 92
92 -
 93
93 -
 94
94 -
 95
95 -
 96
96 -
 97
97 -
 98
98 -
 99
99 -
 100
100 -
 101
101 -
 102
102 -
 103
103 -
 104
104 -
 105
105 -
 106
106 -
 107
107 -
 108
108 -
 109
109 -
 110
110 -
 111
111 -
112
-
113
-
114
-
115
-
116
-
117
-
118
-
119
-
120
-
121
-
122
-
123
-
124
-
125
-
126
 |
 |

95
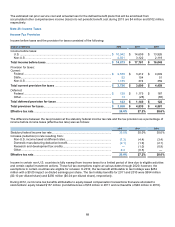
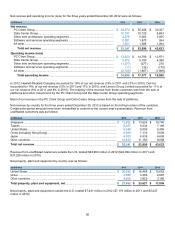
Net revenue and operating income (loss) for the three years ended December 29, 2012 were as follows:
(In Millions)
2012
2011
2010
Net revenue
PC Client Group ...................................................................................................
$ 34,274
$ 35,406
$ 30,327
Data Center Group...............................................................................................
10,741
10,129
8,693
Other Intel architecture operating segments........................................................
4,378
5,005
3,055
Software and services operating segments .........................................................
2,381
1,870
264
All other ................................................................................................................
1,567
1,589
1,284
Total net revenue ...........................................................................................
$ 53,341
$ 53,999
$ 43,623
Operating income (loss)
PC Client Group ...................................................................................................
$ 13,053
$ 14,793
$ 12,971
Data Center Group...............................................................................................
5,073
5,100
4,388
Other Intel architecture operating segments........................................................
(1,377)
(577)
270
Software and services operating segments .........................................................
(11)
(32)
(175)
All other ................................................................................................................
(2,100)
(1,807)
(1,866)
Total operating income .................................................................................
$ 14,638
$ 17,477
$ 15,588
In 2012, Hewlett-Packard Company accounted for 18% of our net revenue (19% in 2011 and 21% in 2010), Dell Inc.
accounted for 14% of our net revenue (15% in 2011 and 17% in 2010), and Lenovo Group Limited accounted for 11% of
our net revenue (9% in 2011 and 8% in 2010). The majority of the revenue from these customers was from the sale of
platforms and other components by the PC Client Group and the Data Center Group operating segments.
Most of our revenue in the PC Client Group and Data Center Group comes from the sale of platforms.
Net revenue by country for the three years ended December 29, 2012 is based on the billing location of the customer.
Certain prior-period amounts have been reclassified to conform to the current year’s presentation. Revenue from
unaffiliated customers was as follows:
(In Millions)
2012
2011
2010
Singapore .......................................................................................................................
$ 12,622
$ 13,626
$ 10,740
Taiwan ............................................................................................................................
9,327
8,534
7,189
United States..................................................................................................................
8,348
9,005
6,395
China (including Hong Kong)..........................................................................................
8,299
7,133
5,636
Japan..............................................................................................................................
4,303
4,538
4,655
Other countries...............................................................................................................
10,442
11,163
9,008
Total net revenue..........................................................................................................
$ 53,341
$ 53,999
$ 43,623
Revenue from unaffiliated customers outside the U.S. totaled $44,993 million in 2012 ($44,994 million in 2011 and
$37,228 million in 2010).
Net property, plant and equipment by country was as follows:
(In Millions)
2012
2011
2010
United States..............................................................................................................
$ 20,542
$ 16,448
$ 12,652
Israel...........................................................................................................................
3,389
3,356
2,087
Other countries...........................................................................................................
4,052
3,823
3,160
Total property, plant and equipment, net...............................................................
$ 27,983
$ 23,627
$ 17,899
Net property, plant and equipment outside the U.S. totaled $7,441 million in 2012 ($7,179 million in 2011 and $5,247
million in 2010).