Intel 2012 Annual Report Download - page 34
Download and view the complete annual report
Please find page 34 of the 2012 Intel annual report below. You can navigate through the pages in the report by either clicking on the pages listed below, or by using the keyword search tool below to find specific information within the annual report.-
 1
1 -
2
-
3
-
4
-
5
-
6
-
7
-
8
-
9
-
10
-
11
-
12
-
13
-
14
-
15
-
16
-
17
-
18
-
19
-
20
-
21
-
22
-
23
-
 24
24 -
 25
25 -
 26
26 -
 27
27 -
 28
28 -
 29
29 -
 30
30 -
 31
31 -
 32
32 -
 33
33 -
 34
34 -
 35
35 -
 36
36 -
 37
37 -
 38
38 -
 39
39 -
 40
40 -
 41
41 -
 42
42 -
 43
43 -
 44
44 -
45
-
46
-
47
-
48
-
49
-
50
-
51
-
52
-
53
-
54
-
55
-
56
-
57
-
58
-
59
-
60
-
61
-
62
-
63
-
64
-
65
-
66
-
67
-
68
-
69
-
70
-
71
-
72
-
73
-
74
-
75
-
76
-
77
-
78
-
79
-
80
-
81
-
82
-
83
-
84
-
85
-
86
-
87
-
88
-
89
-
90
-
91
-
92
-
93
-
94
-
95
-
96
-
97
-
98
-
99
-
100
-
101
-
102
-
103
-
104
-
105
-
106
-
107
-
108
-
109
-
110
-
111
-
112
-
113
-
114
-
115
-
116
-
117
-
118
-
119
-
120
-
121
-
122
-
123
-
124
-
125
-
126
 |
 |
28
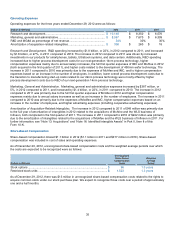
• the recognition and measurement of loss contingencies, which impact gross margin or operating expenses when
we recognize a loss contingency, revise the estimate for a loss contingency, or record an asset impairment.
In the following section, we discuss these policies further, as well as the estimates and judgments involved.
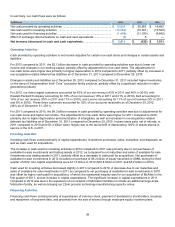
Non-Marketable Equity Investments
We regularly invest in non-marketable equity instruments of private companies, which range from early-stage companies
that are often still defining their strategic direction to more mature companies with established revenue streams and
business models. The carrying value of our non-marketable equity investment portfolio, excluding equity derivatives,
totaled $2.2 billion as of December 29, 2012 ($2.8 billion as of December 31, 2011).
Our non-marketable equity investments are recorded using the cost method or the equity method of accounting,
depending on the facts and circumstances of each investment. Our non-marketable equity investments are classified
within other long-term assets on the consolidated balance sheets.
Non-marketable equity investments are inherently risky, and their success depends on product development, market
acceptance, operational efficiency, the ability of the investee companies to raise additional funds in financial markets that
can be volatile, and other key business factors. The companies could fail or not be able to raise additional funds when
needed, or they may receive lower valuations with less favorable investment terms than previous financings. These
events could cause our investments to become impaired. In addition, financial market volatility could negatively affect our
ability to realize value in our investments through liquidity events such as initial public offerings, mergers, and private
sales. For further information about our investment portfolio risks, see “Risk Factors” in Part I, Item 1A of this Form 10-K.
We determine the fair value of our non-marketable equity investments portfolio quarterly for disclosure purposes;
however, the investments are recorded at fair value only if an impairment charge is recognized. We determine the fair
value of our non-marketable equity investments using the market and income approaches. The market approach includes
the use of financial metrics and ratios of comparable public companies, such as projected revenues, earnings, and
comparable performance multiples. The selection of comparable companies requires management judgment and is based
on a number of relevant factors, including comparable companies’ sizes, growth rates, industries, and development
stages. The income approach includes the use of a discounted cash flow model, which may include one or multiple
discounted cash flow scenarios and requires the following significant estimates for the investee: revenue; expenses,
capital spending, and other costs; and discount rates based on the risk profile of comparable companies. Estimates of
revenue, expenses, capital spending, and other costs are developed using available market, historical, and forecast data.
The valuation of our non-marketable equity investments also takes into account variables such as conditions reflected in
the capital markets, recent financing activities by the investees, the investees’ capital structures, the terms of the
investees’ issued interests, and the lack of marketability of the investments.
For non-marketable equity investments, the measurement of fair value requires significant judgment and includes
quantitative and qualitative analysis of identified events or circumstances that impact the fair value of the investment, such
as:
• the investee’s revenue and earnings trends relative to pre-defined milestones and overall business prospects;
• the technological feasibility of the investee’s products and technologies;
• the general market conditions in the investee’s industry or geographic area, including adverse regulatory and
economic changes;
• factors related to the investee’s ability to remain in business, such as the investee’s liquidity, debt ratios, and the
rate at which the investee is using its cash; and
• the investee’s receipt of additional funding at a lower valuation.
If the fair value of an investment is below our carrying value, we determine whether the investment is other-than-
temporarily impaired based on our quantitative and qualitative analysis, which includes assessing the severity and
duration of the impairment and the likelihood of recovery before disposal. If the investment is considered to be other-than-
temporarily impaired, we write down the investment to its fair value. Impairments of non-marketable equity investments
were $104 million in 2012. Over the past 12 quarters, including the fourth quarter of 2012, impairments of non- marketable
equity investments ranged from $8 million to $59 million per quarter.