Intel 2012 Annual Report Download - page 51
Download and view the complete annual report
Please find page 51 of the 2012 Intel annual report below. You can navigate through the pages in the report by either clicking on the pages listed below, or by using the keyword search tool below to find specific information within the annual report.-
 1
1 -
2
-
3
-
4
-
5
-
6
-
7
-
8
-
9
-
10
-
11
-
12
-
13
-
14
-
15
-
16
-
17
-
18
-
19
-
20
-
21
-
22
-
23
-
24
-
25
-
26
-
27
-
28
-
29
-
30
-
31
-
32
-
33
-
34
-
35
-
36
-
37
-
38
-
39
-
40
-
 41
41 -
 42
42 -
 43
43 -
 44
44 -
 45
45 -
 46
46 -
 47
47 -
 48
48 -
 49
49 -
 50
50 -
 51
51 -
 52
52 -
 53
53 -
 54
54 -
 55
55 -
 56
56 -
 57
57 -
 58
58 -
 59
59 -
 60
60 -
 61
61 -
62
-
63
-
64
-
65
-
66
-
67
-
68
-
69
-
70
-
71
-
72
-
73
-
74
-
75
-
76
-
77
-
78
-
79
-
80
-
81
-
82
-
83
-
84
-
85
-
86
-
87
-
88
-
89
-
90
-
91
-
92
-
93
-
94
-
95
-
96
-
97
-
98
-
99
-
100
-
101
-
102
-
103
-
104
-
105
-
106
-
107
-
108
-
109
-
110
-
111
-
112
-
113
-
114
-
115
-
116
-
117
-
118
-
119
-
120
-
121
-
122
-
123
-
124
-
125
-
126
 |
 |

45
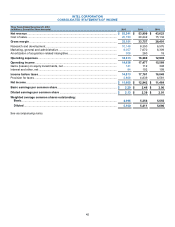
INTEL CORPORATION
CONSOLIDATED STATEMENTS OF INCOME
Three Years Ended December 29, 2012
(In Millions, Except Per Share Amounts)
2012
2011
2010
Net revenue ........................................................................................................................
$ 53,341
$ 53,999
$ 43,623
Cost of sales........................................................................................................................
20,190
20,242
15,132
Gross margin .....................................................................................................................
33,151
33,757
28,491
Research and development................................................................................................
10,148
8,350
6,576
Marketing, general and administrative.................................................................................
8,057
7,670
6,309
Amortization of acquisition-related intangibles ................................................................
308
260
18
Operating expenses ..........................................................................................................
18,513
16,280
12,903
Operating income ..............................................................................................................
14,638
17,477
15,588
Gains (losses) on equity investments, net...........................................................................
141
112
348
Interest and other, net .........................................................................................................
94
192
109
Income before taxes..........................................................................................................
14,873
17,781
16,045
Provision for taxes...............................................................................................................
3,868
4,839
4,581
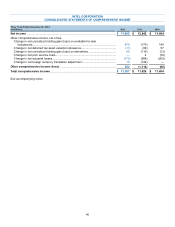
Net income .........................................................................................................................
$ 11,005
$ 12,942
$ 11,464
Basic earnings per common share..................................................................................
$ 2.20
$ 2.46
$ 2.06
Diluted earnings per common share ...............................................................................
$ 2.13
$ 2.39
$ 2.01
Weighted average common shares outstanding:
Basic...............................................................................................................................
4,996
5,256
5,555
Diluted ............................................................................................................................
5,160
5,411
5,696
See accompanying notes.