Ingram Micro 2000 Annual Report Download - page 4
Download and view the complete annual report
Please find page 4 of the 2000 Ingram Micro annual report below. You can navigate through the pages in the report by either clicking on the pages listed below, or by using the keyword search tool below to find specific information within the annual report.-
 1
1 -
 2
2 -
 3
3 -
 4
4 -
 5
5 -
 6
6 -
 7
7 -
 8
8 -
 9
9 -
 10
10 -
 11
11 -
 12
12 -
 13
13 -
 14
14 -
 15
15 -
16
-
17
-
18
-
19
-
20
-
21
-
22
-
23
-
24
-
25
-
26
-
27
-
28
-
29
-
30
-
31
-
32
-
33
-
34
-
35
-
36
-
37
-
38
-
39
-
40
-
41
-
42
-
43
-
44
-
45
-
46
-
47
-
48
-
49
-
50
-
51
-
52
-
53
-
54
-
55
-
56
-
57
-
58
-
59
-
60
-
61
 |
 |

.02 |
Dear Shareowners,
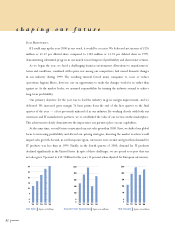
If I could sum up the year 2000 in one word, it would be execution.We delivered net income of $226
million or $1.52 per diluted share compared to $183 million or $1.24 per diluted share in 1999,
demonstrating substantial progress in our march toward improved profitability and shareowner returns.
As we began the year, we faced a challenging business environment. Alterations to manufacturers’
terms and conditions, combined with a price war among our competitors, had caused dramatic changes
in our industry during 1999. The resulting turmoil forced many companies to cease or reduce
operations. Ingram Micro, however, saw an opportunity to make the changes work for us rather than
against us. As the market leader, we assumed responsibility for turning the industry around to achieve
long-term profitability.
Our primary objective for the year was to lead the industry in gross margin improvement, and we
delivered. We increased gross margin 76 basis points from the end of the first quarter to the final
quarter of the year — a feat previously unheard of in our industry. By working closely with both our
customers and IT manufacturer partners, we re-established the value of our services in the marketplace.
This achievement clearly demonstrates the importance our partners place on our capabilities.
At the same time, several factors constrained our net sales growth in 2000. First, we shifted our global
focus to increasing profitability and altered our pricing strategies, knowing the market reaction would
impact sales growth. Second, in our European region, currencies were weaker and growth in demand for
IT products was less than in 1999. Finally, in the fourth quarter of 2000, demand for IT products
declined significantly in the United States. In spite of these challenges, we are proud to report that our
net sales grew 9 percent to $30.7 billion for the year (13 percent when adjusted for European currencies).
shaping our future
INGRAM MICRO
‘98
‘99 ‘00
25
30
20
15
10
5
0
$
‘97
‘96
‘98
‘99 ‘00
$
‘97
‘96
200
250
150
100
50
0
Net Income]figures in millions
Net Sales]figures in billions Income From Operations]figures in millions
‘98
‘99 ‘00
$
‘97
‘96
400
500
300
200
100
0