INTL FCStone 2013 Annual Report Download - page 13
Download and view the complete annual report
Please find page 13 of the 2013 INTL FCStone annual report below. You can navigate through the pages in the report by either clicking on the pages listed below, or by using the keyword search tool below to find specific information within the annual report.exchanges, including the Chicago Mercantile
Exchange and its divisions, the Chicago Board of
Trade, the New York Mercantile Exchange and
COMEX; ICE Futures U.S., formerly known as the
New York Board of Trade; and the Minneapolis
Grain Exchange (“MGEX”). FCStone, LLC is one of the
largest independent FCMs in the U.S., as measured by
required customer segregated assets, not afliated
with a major nancial institution or commodity
intermediary, end-user or producer. As of September
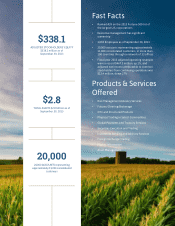
30, 2013, FCStone, LLC had approximately $1.7
billion in required customer segregated assets.
Revenues in our clearing activities are derived from
clearing fees, commissions and interest earned on
customer balances. The exact amount of interest
retained is negotiated with each customer. We also
charge a variety of fees for services and technology.
Key costs for this business are employment costs
and the costs of technology to provide the clearing
service to our customers.
The commodities business was acquired when
we merged with FCStone in 2009. At the time of
the acquisition, this business was re-structured
to eliminate high-risk customers that accounted
for the majority of the transaction volume. In line
with our corporate strategy, we have focused on
niche customers where we believe we can earn an
appropriate risk-adjusted return, including oor
traders and “locals” as well as mid-sized trading
rms, CTAs and funds. We also look to leverage
our capabilities and capacity by offering facilities
management or outsourcing solutions to other FCMs
that may not have the necessary scale to self-clear.
The futures clearing business is a low margin,
low-touch business that is highly competitive
and characterized by surplus capacity, which has
driven down returns. The industry has suffered
from a number of well-publicized failures, which
has led to increased regulation and a resultant
increase in costs, as well as potentially more
capital being required to support customer activity.
This industry has generally been unprotable
due to low interest rates, which are a signicant
driver of clearing revenues. We have already seen
meaningful consolidation in the industry, which is
likely to continue until surplus capacity is removed,
and capital committed to the industry earns an
appropriate return. This is a scale business with high
xed costs and marginally incremental variable
costs, which tends to force pricing down to the
marginal cost point. Our response to this has been
to maintain our margins and seek out customers
that value our higher service levels and the fact
that we are well-capitalized and one of the larger
independent FCMs.
Financial Results
Management believes that the best way to assess
our nancial performance is on a fully marked-
to-market basis. Our Form 10-K, included in this
Annual Report, provides a detailed reconciliation of
these numbers to the audited numbers. We will be
reviewing our segment presentation in light of the
growth of certain of our businesses.
For the 2013 scal year net adjusted earnings were
$12.4 million (2012-$17.0 million, as restated). This
equated to an ROE of 4% -- signicantly below our
stated long-term target of 15%.
Fiscal 2013 highlights:
• Record adjusted operating revenues of $467.3
million.
• Completed expansion and renewal of a three-
year syndicated committed loan facility for
$140.0 million.
• Completed our rst debt offering with a $45.5
million offering of Senior Notes due in July
2020.
• Successfully registered INTL FCStone Markets,
LLC as a swap dealer.
• Increased capacity of global payments business
with a successful migration to a new technology
platform.
• Successfully transferred the accounts and
integrated the operations of Tradewire
Securities, LLC.
• Reached an agreement to transfer the accounts
of First American Capital and Trading Corp., a
transaction which closed in the rst quarter
of scal 2014, adding correspondent clearing
service capabilities to our Securities segment.
We experienced growth in adjusted operating
revenues during scal 2013 compared to scal 2012.
Net operating revenues, which represent operating
revenues net of transaction-based clearing expenses,
introducing broker commissions and interest
expense, declined $8.8 million, primarily resulting
from an increase in transaction-based expenses in
the Securities and Clearing and Execution Services
(“CES”) segments.
All of our segments, with the exception of the
Commodity and Risk Management Services (“C&RM”)
segment, experienced operating revenue growth
over the prior year. The decrease in our core C&RM


