INTL FCStone 2005 Annual Report Download - page 2
Download and view the complete annual report
Please find page 2 of the 2005 INTL FCStone annual report below. You can navigate through the pages in the report by either clicking on the pages listed below, or by using the keyword search tool below to find specific information within the annual report.-
 1
1 -
 2
2 -
 3
3 -
 4
4 -
 5
5 -
 6
6 -
 7
7 -
 8
8 -
 9
9 -
 10
10 -
 11
11 -
 12
12 -
 13
13 -
14
-
15
-
16
-
17
-
18
-
19
-
20
-
21
-
22
-
23
-
24
-
25
-
26
-
27
-
28
-
29
-
30
-
31
-
32
-
33
-
34
-
35
-
36
-
37
-
38
-
39
-
40
-
41
-
42
-
43
-
44
-
45
-
46
-
47
-
48
-
49
-
50
-
51
-
52
-
53
-
54
-
55
-
56
-
57
-
58
-
59
-
60
-
61
-
62
-
63
-
64
-
65
-
66
-
67
-
68
-
69
-
70
-
71
-
72
-
73
-
74
-
75
-
76
-
77
-
78
-
79
-
80
-
81
-
82
-
83
-
84
-
85
 |
 |

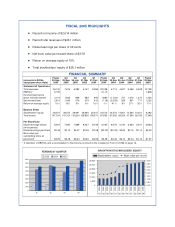
FISCAL 2005 HIGHLIGHTS
ŠRecord net income of $2.614 million
ŠRecord total revenues of $26.1 million
ŠDiluted earnings per share of 33 cents
ŠNet book value per issued share of $3.78
ŠReturn on average equity of 10%
ŠTotal stockholders’ equity of $28.1 million
FINANCIAL SUMMARY
(amounts in $000s,
except per share data)
Fiscal
30-Sep
2005
Q4
30-Sep
2005
Q3
30-Jun
2005
Q2
31-Mar
2005
Q1
31-Dec
2004
Fiscal
30-Sep
2004
Q4
30-Sep
2004
Q3
30-Jun
2004
Q2
31-Mar
2004
Q1
31-Dec
2003
Fiscal
30-Sep
2003
Statement of Operations
Total revenues 26,140 7,615 6,282 6,157 6,085 22,038 5,713 4,627 6,369 5,329 10,798
EBITDA* 5,139 5,113 1,808
Income/(loss) before
taxes, minority interest 4,119 1,645 899 582 994 1,880 (1,723) 757 1,572 1,274 1,455
Net income/(loss) 2,614 1,046 576 379 612 (118) (2,029) 289 851 771 1,252
Return on average equity 10% 15% 9% 6% 10% -1% -41% 8% 27% 32% 17%
Balance Sheet
Stockholders’ equity 28,072 28,072 26,991 26,395 25,447 24,573 24,573 14,901 14,564 10,201 9,282
Total assets 147,104 147,104 131,824 109,800 108,071 67,692 67,692 39,205 47,993 26,765 17,348
Per Share Data
Diluted average shares
(in thousands)
8,024 7,990 7,989 8,057 8,046 5,090 6,076 5,742 5,654 5,401 3,863
Diluted earnings per share $0.33 $0.13 $0.07 $0.05 $0.08 ($0.02) ($0.33) $0.05 $0.15 $0.14 $0.32
Book value per
outstanding share at
period end $3.78 $3.78 $3.64 $3.60 $3.59 $3.48 $3.48 $3.10 $3.04 $2.15 $1.97
* A definition of EBITDA and a reconciliation to Net income is shown in the Company’s Form 10-KSB on page 15.