ING Direct 2009 Annual Report Download - page 15
Download and view the complete annual report
Please find page 15 of the 2009 ING Direct annual report below. You can navigate through the pages in the report by either clicking on the pages listed below, or by using the keyword search tool below to find specific information within the annual report.
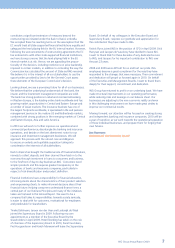
result of the agreement, ING was able to repurchase EUR 5 billion
of the core Tier 1 securities at the issue price (EUR 10 per security).
The total payment amounted to EUR 5,605 million and consisted
of a repayment of the EUR 5 billion principal amount plus accrued
coupon from 12 May 2009 to 20 December 2009 of EUR 259
million and a premium of EUR 346 million.
Furthermore, in order to obtain approval from the EC on our
restructuring plan, additional payments will be made to the Dutch
State for the IABF, corresponding to a reduction of 50 basis points
on the funding fee monthly received by ING and an increase of
82.6 basis points on the guarantee fee annually paid by ING. In
total, these annual extra payments amounted to a net present
value of EUR 1.3 billion, which was booked as a one-time pre-tax
charge in the fourth quarter of 2009. Under the agreement,
the IABF as announced in January 2009, including the transfer
price of the securities of 90%, will remain unaltered.
In order to finance the repayment of the core Tier 1 securities and
to mitigate the EUR 1.3 billion pre-tax capital impact of the
additional payments for the IABF, ING launched a EUR 7.5 billion
rights issue. ING aims to finance any further repayments of
core Tier 1 securities from internal resources, including proceeds
from the divestment of the insurance operations.
FINANCIAL HIGHLIGHTS ING GROUP 2009
Notwithstanding the challenging environment in 2009, ING
significantly improved its operating performance, successfully
reduced expenses and returned to profit on an underlying basis.
Total net result of the Group decreased by EUR 206 million to
EUR –935 million. This net loss reflects a one-time after tax charge
due to an accrual of additional future payments to the Dutch state
of EUR 930 million after tax for the IABF as part of the agreement
with the EC announced in October 2009. On an underlying basis,
ING posted a positive net result of EUR 748 million for the full-year
2009, compared with a loss of EUR 304 million in 2008, as financial
markets began to stabilise and operating conditions improved.
As a result of our Back to Basics programme, operating expenses,
included in underlying result, were reduced by 6.9%, or EUR 987
million (pre-tax).
Underlying net result is derived from total net result by excluding
the impact from divestments and special items. Special items were
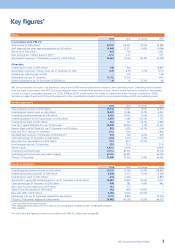
ING results 2009*
Group Banking Insurance
EUR million 2009 2008 2009 2008 2009 2008
Underlying result before tax, excluding market impact,
risk costs and VA assumption changes 8,767 7,023 7,393 5,263 1,374 1,760
Subprime RMBS –350 –120 –160 –81 –190 –39
Alt-A RMBS –1,405 –2,063 –1,245 –1,823 –160 –240
Prime RMBS –47 0–47 0 0 0
Other ABS –37 –4 –37 –4 0 0
CDO/CLO 133 –394 –1 –122 134 –272
CMBS –25 000–25 0
Monoliners –58 –9 –58 –9 0 0
Other debt securities –174 –809 0–255 –174 –554
Impairments / fair value changes debt securities –1,963 –3,399 –1,548 –2,294 –415 –1,105
Equity securities impairments –302 –1,454 –49 –331 –253 –1,123
Capital gains on equity securities 426 754 24 30 402 724
Hedges on direct equity exposure –312 482 0 0 –312 482
Hedges on indirect equity exposure –417 –49 0 0 – 417 -49
DAC unlocking –351 –1,094 0 0 –351 –1,094
Equity related impact –957 –1,361 –25 –302 –932 –1,059
Real Estate revaluations / impairments –2,156 –1,173 –1,687 –732 –469 – 441
Private equity revaluations 56 –413 0 0 56 –413
Real Estate / Private equity –2,10 0 –1,587 –1,687 –732 –413 –855
Capital gains on debt securities 33 –106 –19 052 –106
Other market impact 244 –220 –241 –206 485 –14
Other 278 –325 260 –206 –538 –119
Total market impacts –4,742 –6,674 –3,520 –3,534 –1,222 –3,140
Loan loss provisions Bank –2,973 –1,280 –2,973 –1,280 0 0
Variable annuity assumption changes –343 000–343 0
Total market volatility, risk costs and variable
annuity assumption changes –8,058 –7,954 –6,493 –4,814 –1,565 –3,140
Underlying result before tax 709 –931 900 449 –191 –1,380
Tax and third party interests –38 –627 – 61 –273 23 –354
Underlying net result 748 –304 961 722 –214 –1,026
Divestments and special items –1,683 –425 –1,261 –267 –422 –158
Total net result –935 –729 –299 454 –636 –1,183
* Numbers may not add up due to rounding.
ING Group Annual Report 2009 13


