ING Direct 2007 Annual Report Download - page 3
Download and view the complete annual report
Please find page 3 of the 2007 ING Direct annual report below. You can navigate through the pages in the report by either clicking on the pages listed below, or by using the keyword search tool below to find specific information within the annual report.-
 1
1 -
 2
2 -
 3
3 -
 4
4 -
 5
5 -
 6
6 -
 7
7 -
 8
8 -
 9
9 -
 10
10 -
 11
11 -
 12
12 -
 13
13 -
 14
14 -
15
-
16
-
17
-
18
-
19
-
20
-
21
-
22
-
23
-
24
-
25
-
26
-
27
-
28
-
29
-
30
-
31
-
32
-
33
-
34
-
35
-
36
 |
 |

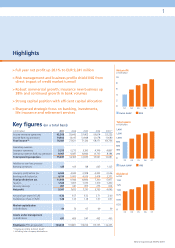
04 0705 0603
0
2
4
6
8
1
0
Dutch GAAP IFRS
04 0703 05 06
Dutch GAAP IFRS
1,400
1,200
1,000
800
600
4
00
200
0
04 0703 05 06
0
0.25
0.50
0.75
1.00
1.25
1.50
> Full year net profi t up 20.1% to EUR 9,241 million
> Risk management and business profi le shield ING from
direct impact of credit market turmoil
> Robust commercial growth: insurance new business up
38% and continued growth in bank volumes
> Strong capital position with effi cient capital allocation
> Sharpened strategic focus on banking, investments,
life insurance and retirement services
in EUR million 2007 2006 2005 2004 2003 (1)
Income Insurance operations 62,208 59,642 57,403 55,614 53,223
Income Banking operations 14,602 14,195 13,848 12,678 11,680
Total income (2) 76,587 73,621 71,120 68,171 64,736
Operating expenses
Insurance operations 5,515 5,275 5,195 4,746 4,897
Operating expenses Banking operations 9,967 9,087 8,844 8,795 8,184
Total operating expenses 15,481 14,362 14,039 13,541 13,081
Addition to loan loss provision
Banking operations 125 103 88 465 1,125
Insurance profi t before tax 6,533 4,935 3,978 4,322 3,506
Banking profi t before tax 4,510 5,005 4,916 3,418 2,371
Total profi t before tax 11,043 9,940 8,894 7,740 5,877
Taxation 1,534 1,907 1,379 1,709 1,490
Minority interests 267 341 305 276 344
Net profi t 9,241 7,692 7,210 5,755 4,043
Net profi t per share (in EUR) 4.32 3.57 3.32 2.71 2.00
Dividend per share (in EUR) 1.48 1.32 1.18 1.07 0.97
Market capitalisation
(in EUR billion) 60 74 65 49 39
Assets under management
(in EUR billion) 637 600 547 492 463
Employees (FTEs at year-end) 124,634 119,8 01 116,614 112,195 114, 335
(1) Figures according to Dutch GAAP.
(2) Including inter-company eliminations.
Net profi t
in EUR billion
Total assets
in EUR billion
Dividend
in EUR
1
Highlights
ING Group Annual Review 2007
Key fi gures (on a total basis)