ING Direct 2004 Annual Report Download - page 13
Download and view the complete annual report
Please find page 13 of the 2004 ING Direct annual report below. You can navigate through the pages in the report by either clicking on the pages listed below, or by using the keyword search tool below to find specific information within the annual report.-
 1
1 -
2
-
 3
3 -
 4
4 -
 5
5 -
 6
6 -
 7
7 -
 8
8 -
 9
9 -
 10
10 -
 11
11 -
 12
12 -
 13
13 -
 14
14 -
 15
15 -
 16
16 -
 17
17 -
 18
18 -
 19
19 -
 20
20 -
 21
21 -
 22
22 -
 23
23 -
24
-
25
-
26
-
27
-
28
-
29
-
30
-
31
-
32
-
33
-
34
-
35
-
36
-
37
-
38
-
39
-
40
-
41
-
42
-
43
-
44
-
45
-
46
-
47
-
48
-
49
-
50
-
51
-
52
-
53
-
54
-
55
-
56
-
57
-
58
-
59
-
60
-
61
-
62
-
63
-
64
-
65
-
66
-
67
-
68
-
69
-
70
-
71
-
72
-
73
-
74
-
75
-
76
-
77
-
78
-
79
-
80
-
81
-
82
-
83
-
84
-
85
-
86
-
87
-
88
-
89
-
90
-
91
-
92
-
93
-
94
-
95
-
96
-
97
-
98
-
99
-
100
-
101
-
102
-
103
-
104
-
105
-
106
-
107
-
108
-
109
-
110
-
111
-
112
-
113
-
114
-
115
-
116
-
117
-
118
-
119
-
120
-
121
-
122
-
123
-
124
-
125
-
126
-
127
-
128
-
129
-
130
-
131
-
132
-
133
-
134
-
135
-
136
-
137
-
138
-
139
-
140
-
141
-
142
-
143
-
144
-
145
-
146
-
147
-
148
-
149
-
150
-
151
-
152
-
153
-
154
-
155
-
156
-
157
-
158
-
159
-
160
-
161
-
162
-
163
-
164
-
165
-
166
-
167
-
168
-
169
-
170
-
171
-
172
-
173
-
174
-
175
-
176
-
177
-
178
-
179
-
180
-
181
-
182
-
183
 |
 |

REPORT OF THE EXECUTIVE BOARD
FINANCIAL HIGHLIGHTS
ING achieved strong results in 2004 with a rise in operating
net profit of 33% to EUR 5,389 million. Including capital gains
on shares, net profit even increased by 48% to 5,968 million.
Moreover, ING successfully sold non-core and underperforming
business units in 2004. The proceeds of these sales were used to
strengthen the capital position, leading to a sharp improvement
of the debt/equity ratio to 9.9%, under the 10% target.
ING decided to return to full cash dividend as from the final
2004 dividend.
The rise in the Group’s operating net profit was led by a
strong performance at ING’s banking operations, notably ING
Direct and Wholesale Banking. The insurance operations also
posted a healthy profit growth, driven by the life insurance
activities in Asia/Pacific and the core businesses in the United
States, and continued strong non-life results in Canada.
Given EUR 579 million in realised capital gains on shares in
2004, net profit amounted to EUR 5,968 million, an increase
of 48% compared to 2003. The high level of capital gains on
shares, most of which were realised in the second half of 2004,
was the result of a decision to sell part of the Dutch equity
portfolio to reduce volatility of the solvency ratios.
The 2004 result was also influenced by the considerable
strengthening of the euro against most currencies. This had
a negative impact of EUR 86 million on net profit, but it was
offset by a gain of EUR 188 million after tax on the U.S. dollar
hedge. From 2005, ING no longer has hedges in place for the
U.S. dollar.
Particularly encouraging was the robust increase in total
operating income of 11% (excluding the impact of acquisitions,
divestments and currency effects). The insurance business lines
posted strong growth in premium income, while product-
pricing was adjusted to increase returns on new business.
The banking business lines continued to benefit from lower
risk costs, and operating income showed a solid increase,
despite pressure on interest rates in the past year.
Total operating expenses increased by 6% (excluding the
impact of acquisitions, divestments and currency effects).
This was the result of some one-offs and non-recurring
expenses, but underlying costs were contained, except at
Nationale-Nederlanden, where ING continued to invest
deliberately to meet the structural improvements required.
The operating net return on equity increased to 22.9% in 2004
from 21.5% in 2003. The operating net return on equity of the
insurance operations was 22.6% in 2004, little changed from
2003, while the operating net return on equity from banking
rose to 15.8% from 11.1%.
1.2
OUR PERFORMANCE
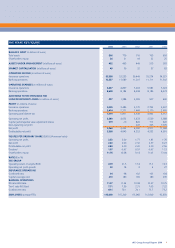
ING GROUP 2004 CONSOLIDATED PROFIT & LOSS ACCOUNT
in millions of euros 2004 2003 change
Total operating income 67,814 64,746 4.7%
Total operating expenditure 60,395 58,889 2.6%
Operating profit before tax 7,419 5,857 26.7%
Taxation 1,758 1,460 20.4%
Third-party interests 272 344 -20.9%
Operating net profit 5,389 4,053 33.0%
Capital gains/losses on shares 579 -10
Net profit 5,968 4,043 47.6%
ROBUST RESULTS AND IMPROVED CAPITAL POSITION
ING Group Annual Report 2004 11
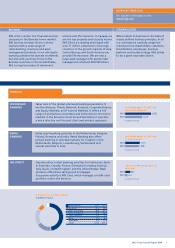
*Excludes component ‘other’ in banking
and insurance.
OPERATING PROFIT BEFORE TAX
PER BUSINESS LINE*
Insurance Europe 22% 1,733
Insurance Americas 22% 1,669
Insurance Asia/Pacific 10% 751
Wholesale Banking 25% 1,932
Retail Banking 15% 1,170
ING Direct 6% 432