Huntington National Bank 2007 Annual Report Download - page 2
Download and view the complete annual report
Please find page 2 of the 2007 Huntington National Bank annual report below. You can navigate through the pages in the report by either clicking on the pages listed below, or by using the keyword search tool below to find specific information within the annual report.-
 1
1 -
 2
2 -
 3
3 -
 4
4 -
 5
5 -
 6
6 -
 7
7 -
 8
8 -
 9
9 -
 10
10 -
 11
11 -
 12
12 -
 13
13 -
14
-
15
-
16
-
17
-
18
-
19
-
20
-
21
-
22
-
23
-
24
-
25
-
26
-
27
-
28
-
29
-
30
-
31
-
32
-
33
-
34
-
35
-
36
-
37
-
38
-
39
-
40
-
41
-
42
-
43
-
44
-
45
-
46
-
47
-
48
-
49
-
50
-
51
-
52
-
53
-
54
-
55
-
56
-
57
-
58
-
59
-
60
-
61
-
62
-
63
-
64
-
65
-
66
-
67
-
68
-
69
-
70
-
71
-
72
-
73
-
74
-
75
-
76
-
77
-
78
-
79
-
80
-
81
-
82
-
83
-
84
-
85
-
86
-
87
-
88
-
89
-
90
-
91
-
92
-
93
-
94
-
95
-
96
-
97
-
98
-
99
-
100
-
101
-
102
-
103
-
104
-
105
-
106
-
107
-
108
-
109
-
110
-
111
-
112
-
113
-
114
-
115
-
116
-
117
-
118
-
119
-
120
 |
 |

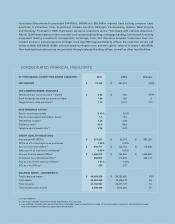
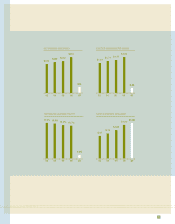
CONSOLIDATED FINANCIAL HIGHLIGHTS
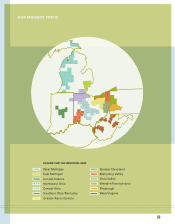
Huntington Bancshares Incorporated (NASDAQ: HBAN) is a $55 billion regional bank holding company head-
quartered in Columbus, Ohio. Its principal markets are Ohio, Michigan, Pennsylvania, Indiana, West Virginia,
and Kentucky. Founded in 1866, Huntington serves its customers as the “local bank with national resources.”
Nearly 12,000 associates provide consumer and commercial banking, mortgage banking, automobile financing,
equipment leasing, investment management, brokerage, trust, and insurance services. Customers have con-
venient access to banking services through more than 600 regional banking offices; the customer service call
center at (800) 480-BANK (2265); online at www.huntington.com; and through its network of nearly 1,400 ATMs.
Non-banking financial services are provided through selected banking offices, as well as other local facilities.
IN THOUSANDS, EXCEPT PER SHARE AMOUNTS 2007 2006 Change
NET INCOME $ 75,169 $ 461,221 (84)%
PER COMMON SHARE AMOUNTS
Net income per common share – diluted $ 0.25 $ 1.92 (87) %
Cash dividends declared per common share 1.06 1.00 6
Tangible book value per share(1) 7.13 10.21 (30)
PERFORMANCE RATIOS
Return on average assets 0.17 % 1.31 %
Return on average shareholders’ equity 1.6 15.7
Net interest margin(2) 3.36 3.29
Efficiency ratio(3) 62.5 59.4
Tangible equity/assets ratio(1) 5.08 6.93
CREDIT QUALITY MEASURES
Net charge-offs (NCOs) $ 477,631 $ 82,376 $ 395,255
NCOs as a % of average loans and leases 1.44 % 0.32 %
Non-accrual loans (NALs)(1) $ 319,771 $ 144,133 $ 175,638
NALs as a % of total loans and leases(1) 0.80 % 0.55 %
Non-performing assets (NPAs)(1) $ 1,660,270 $ 193,620 $ 1,466,650
Allowance for credit losses (ACL)(1) 644,970 312,229 332,741
ACL as a % of total loans and leases(1) 1.61 % 1.19 %
ACL as a % of NALs(1) 202 217
BALANCE SHEET – DECEMBER 31,
Total loans and leases $ 40,054,338 $ 26,153,425 53 %
Total assets 54,697,468 35,329,019 55
Total deposits 37,742,921 25,047,770 51
Total shareholders’ equity 5,949,140 3,014,326 97
(1) AT DECEMBER 31.
(2) ON A FULLY-TAXABLE EQUIVALENT BASIS ASSUMING A 35% TAX RATE.
(3) NON-INTEREST EXPENSE LESS AMORTIZATION OF INTANGIBLE ASSETS DIVIDED BY THE SUM OF FULLY-TAXABLE EQUIVALENT NET INTEREST INCOME
AND NON-INTEREST INCOME EXCLUDING SECURITIES GAINS.