Huntington National Bank 2004 Annual Report Download - page 4
Download and view the complete annual report
Please find page 4 of the 2004 Huntington National Bank annual report below. You can navigate through the pages in the report by either clicking on the pages listed below, or by using the keyword search tool below to find specific information within the annual report.-
 1
1 -
 2
2 -
 3
3 -
 4
4 -
 5
5 -
 6
6 -
 7
7 -
 8
8 -
 9
9 -
 10
10 -
 11
11 -
 12
12 -
 13
13 -
 14
14 -
 15
15 -
16
-
17
-
18
-
19
-
20
-
21
-
22
-
23
-
24
-
25
-
26
-
27
-
28
-
29
-
30
-
31
-
32
-
33
-
34
-
35
-
36
-
37
-
38
-
39
-
40
-
41
-
42
-
43
-
44
-
45
-
46
-
47
-
48
-
49
-
50
-
51
-
52
-
53
-
54
-
55
-
56
-
57
-
58
-
59
-
60
-
61
-
62
-
63
-
64
-
65
-
66
-
67
-
68
-
69
-
70
-
71
-
72
-
73
-
74
-
75
-
76
-
77
-
78
-
79
-
80
-
81
-
82
-
83
-
84
-
85
-
86
-
87
-
88
-
89
-
90
-
91
-
92
-
93
-
94
-
95
-
96
-
97
-
98
-
99
-
100
-
101
-
102
-
103
-
104
-
105
-
106
-
107
-
108
-
109
-
110
-
111
-
112
-
113
-
114
-
115
-
116
-
117
-
118
-
119
-
120
-
121
-
122
-
123
-
124
-
125
-
126
-
127
-
128
-
129
-
130
-
131
-
132
-
133
-
134
-
135
-
136
-
137
-
138
-
139
-
140
-
141
-
142
 |
 |

We continued our focus on being the “local bank with national resources” and, by many measures, this
business model and our performance momentum produced strong results. Financial performance highlights
for 2004 compared with 2003 included:
6% increase in earnings per share
16.8% return on average equity
59% growth in average residential loans
22% growth in average home equity loans and lines
12% growth in average small business loans
11% growth in average total middle market commercial real estate loans
21% year-end exposure to automobile loans and leases, down from 28%
9% growth in average core deposits excluding retail CDs
0.35% net charge-off ratio, down from 0.81%
0.27% year-end non-performing loan ratio, down from 0.36%
476% year-end loan loss reserve to non-performing loan ratio, up from 444%
7.18% year-end tangible common equity, up from 6.79%
14.3% increase in the common stock dividend
Our stock ended the year at $24.74, up 10% from the end of 2003. With reinvested dividends, this
resulted in a 13.4% total return for our shareholders, higher than the 10.8% total return for the S&P 500.
Accomplishments supporting this performance were also impressive.
All seven banking regions contributed to the loan growth. The combination of attractive interest rates
and improved sales expertise resulted in strong growth in residential mortgages and home equity loans. Growth
in small business loans reflected our success in meeting the needs of this important customer segment. Demand
for middle market commercial and industrial loans remained weak through most of the year, though we
experienced growth over the last five months as the economy began to improve. Dealer Sales loan and lease
originations declined, reflecting intense market competition. However, several important new dealer floor
plan relationships were added during the year.
Deposit growth was also broad-based with every region contributing to the growth. Since 2001, we have
increased our ranking in five key markets: Cleveland, Cincinnati and Toledo, Ohio; Indianapolis, Indiana; and
Charleston, West Virginia. We increased our market share in most of our major markets, including our #2
position in Columbus, Ohio and #3 ranking in Grand Rapids, Michigan.
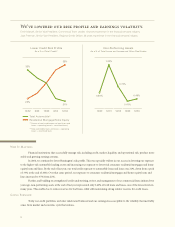
Credit quality at year end was the best it has been in many years. This reflected improvements made
two years ago in strengthening our underwriting practices and policies, as well as a loan portfolio mix change,
reducing balance sheet exposure in automobile finance, and increasing exposure to lower-risk residential
mortgages and home equity loans. Our Special Assets Group was highly successful in aggressively managing
out of lesser-quality and higher-risk commercial loans. Credit quality performance also reflected the positive
carry-over impact from 2003 of our efforts to reduce exposure to higher-risk, nationally syndicated commercial
loans and to lower the number of large commercial loan exposures to individual borrowers.
Loan Growth
2004 Performance Highlights
Deposit Growth
Improved Risk Profile
2