Huntington National Bank 2004 Annual Report Download - page 18
Download and view the complete annual report
Please find page 18 of the 2004 Huntington National Bank annual report below. You can navigate through the pages in the report by either clicking on the pages listed below, or by using the keyword search tool below to find specific information within the annual report.-
 1
1 -
2
-
3
-
4
-
5
-
6
-
7
-
 8
8 -
 9
9 -
 10
10 -
 11
11 -
 12
12 -
 13
13 -
 14
14 -
 15
15 -
 16
16 -
 17
17 -
 18
18 -
 19
19 -
 20
20 -
 21
21 -
 22
22 -
 23
23 -
 24
24 -
 25
25 -
 26
26 -
 27
27 -
 28
28 -
29
-
30
-
31
-
32
-
33
-
34
-
35
-
36
-
37
-
38
-
39
-
40
-
41
-
42
-
43
-
44
-
45
-
46
-
47
-
48
-
49
-
50
-
51
-
52
-
53
-
54
-
55
-
56
-
57
-
58
-
59
-
60
-
61
-
62
-
63
-
64
-
65
-
66
-
67
-
68
-
69
-
70
-
71
-
72
-
73
-
74
-
75
-
76
-
77
-
78
-
79
-
80
-
81
-
82
-
83
-
84
-
85
-
86
-
87
-
88
-
89
-
90
-
91
-
92
-
93
-
94
-
95
-
96
-
97
-
98
-
99
-
100
-
101
-
102
-
103
-
104
-
105
-
106
-
107
-
108
-
109
-
110
-
111
-
112
-
113
-
114
-
115
-
116
-
117
-
118
-
119
-
120
-
121
-
122
-
123
-
124
-
125
-
126
-
127
-
128
-
129
-
130
-
131
-
132
-
133
-
134
-
135
-
136
-
137
-
138
-
139
-
140
-
141
-
142
 |
 |

Huntington views its operations as three distinct lines of business: Regional Banking, Dealer Sales, and the Private
Financial Group (PFG). A fourth segment includes the company’s Treasury functions, capital markets activities,
and other unallocated assets, liabilities, revenue, and expense. Management uses earnings on an operating basis,
rather than on a GAAP basis, to measure underlying performance trends for each business segment. Analyzing
earnings on an operating basis is very helpful in assessing underlying performance trends, a critical factor used
by Management to determine the success of strategies and future earnings capabilities. Operating earnings
represent GAAP earnings adjusted to exclude the impact of certain significant items. (See the Segment Reporting
Note in the Notes to Consolidated Financial Statements in the Financial Information section of this Annual Report
for a complete reconciliation between GAAP and operating earnings.)
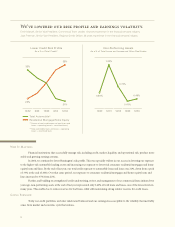
Regional Banking
Lines of Business
Dealer Sales(2) (25%)
Private Financial Group (6%)
Regional Banking (69%)
Dealer Sales (20%)
Private Financial Group (9%)
Total Credit Exposure by Line of Business(1)
at December 31, 2004
Net Income by Line of Business(1)
2004 Full year
(1) Excluding Treasury/Other
(2) Includes operating lease assets and commercial loans;
21% excluding commercial loans
(1) Operating basis and before Treasury/Other
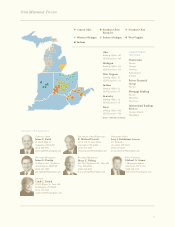
Mary Navarro
Senior Executive Vice President, Retail Banking
29 years experience in the financial services industry
Our people make the difference, whether that is a drive-in teller cashing a
check, a mortgage sales representative helping a customer purchase his or
her first home, or a business banker working with small business owners to
finance their building.
Our “local bank with national resources” model ensures that we make decisions
“close to the customer” while utilizing sophisticated financing and servicing
options to develop customized financial solutions.
Frank Capella
Executive Vice President, Commercial Banking
23 years experience in the financial services industry
16
Regional Banking (71%)