Goldman Sachs 2013 Annual Report Download - page 4
Download and view the complete annual report
Please find page 4 of the 2013 Goldman Sachs annual report below. You can navigate through the pages in the report by either clicking on the pages listed below, or by using the keyword search tool below to find specific information within the annual report.-
 1
1 -
 2
2 -
 3
3 -
 4
4 -
 5
5 -
 6
6 -
 7
7 -
 8
8 -
 9
9 -
 10
10 -
 11
11 -
 12
12 -
 13
13 -
 14
14 -
 15
15 -
16
-
17
-
18
-
19
-
20
-
21
-
22
-
23
-
24
-
25
-
26
-
27
-
28
-
29
-
30
-
31
-
32
-
33
-
34
-
35
-
36
-
37
-
38
-
39
-
40
-
41
-
42
-
43
-
44
-
45
-
46
-
47
-
48
-
49
-
50
-
51
-
52
-
53
-
54
-
55
-
56
-
57
-
58
-
59
-
60
-
61
-
62
-
63
-
64
-
65
-
66
-
67
-
68
-
69
-
70
-
71
-
72
-
73
-
74
-
75
-
76
-
77
-
78
-
79
-
80
-
81
-
82
-
83
-
84
-
85
-
86
-
87
-
88
-
89
-
90
-
91
-
92
-
93
-
94
-
95
-
96
-
97
-
98
-
99
-
100
-
101
-
102
-
103
-
104
-
105
-
106
-
107
-
108
-
109
-
110
-
111
-
112
-
113
-
114
-
115
-
116
-
117
-
118
-
119
-
120
-
121
-
122
-
123
-
124
-
125
-
126
-
127
-
128
-
129
-
130
-
131
-
132
-
133
-
134
-
135
-
136
-
137
-
138
-
139
-
140
-
141
-
142
-
143
-
144
-
145
-
146
-
147
-
148
-
149
-
150
-
151
-
152
-
153
-
154
-
155
-
156
-
157
-
158
-
159
-
160
-
161
-
162
-
163
-
164
-
165
-
166
-
167
-
168
-
169
-
170
-
171
-
172
-
173
-
174
-
175
-
176
-
177
-
178
-
179
-
180
-
181
-
182
-
183
-
184
-
185
-
186
-
187
-
188
-
189
-
190
-
191
-
192
-
193
-
194
-
195
-
196
-
197
-
198
-
199
-
200
-
201
-
202
-
203
-
204
-
205
-
206
-
207
-
208
-
209
-
210
-
211
-
212
-
213
-
214
-
215
-
216
-
217
-
218
-
219
-
220
-
221
-
222
-
223
-
224
-
225
-
226
-
227
-
228
-
229
-
230
-
231
-
232
-
233
-
234
-
235
-
236
-
237
-
238
-
239
-
240
-
241
-
242
 |
 |

2Goldman Sachs 2013 Annual Report
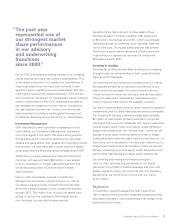
2007 2013
$78
$43
Adapting and Positioning the Firm
The past year marked the five-year anniversary of the global financial crisis.
Later in the letter, we will discuss the impact of the changes we have made
from the extensive review of our business standards and practices. Importantly,
this is also an opportune time to highlight the significant actions the firm has
taken over the last five years related to our capital, liquidity and overall financial
profile to adapt to the realities of the operating and, more specifically, regulatory
environment. Some of those actions are represented to the right.
We have focused not only on strengthening our balance sheet, but also on ensuring
that we are allocating capital efficiently both to meet the needs of our clients and
to generate stronger returns going forward.
New regulation is pushing the industry to be even more sensitive to risk-adjusted
returns, whether through higher capital requirements or the application of stress
tests. Over time, this may translate into greater pricing discipline across the entire
industry, which we view as a positive development.
Well in advance of any regulations being finalized, we have been focused on
developing and implementing tools to help us better price the provision of liquidity
to the marketplace, and better manage our capital usage. In that regard, at the
conclusion of 2013, our estimated transitional Basel III Advanced Common Equity
Tier 1 ratio was in excess of 11 percent.
Another important capital management effort that we have undertaken is refining
our business mix in light of new capital requirements. Certain businesses, like the
Americas reinsurance and European insurance businesses, no longer generated
attractive returns under a Basel III framework and, as a result, we opted to sell
a majority stake in them.
Even with investments, such as the longstanding one that Goldman Sachs had in
Industrial and Commercial Bank of China Limited (ICBC), which was both strategic
and financial, we elected to make adjustments given the new capital requirements.
Collectively, ICBC and our insurance businesses used approximately 125 basis
points of the Basel III Advanced Common Equity Tier 1 ratio and consumed
$40 billion of balance sheet.
While these are three larger, public examples, we continue to make risk-adjusted
return decisions across the firm every day.
Shareholder Returns
As a firm, we have a long track record of delivering superior returns to our
shareholders over the cycle. We demonstrated this before the financial crisis, during
it and after. If you look at our average ROE since the onset of the financial crisis
in 2007, we have outperformed each of our U.S. competitors, having produced an
average ROE during this period of more than four times the peer average.
Nevertheless, while we have generated solid returns in the last five years, they
fall below our aspirations. We are committed to improving them notwithstanding
Letter to Shareholders
Shareholders’ Equity
(in billions)
Our shareholders’ equity has grown from
nearly $43 billion at the end of 2007 to more
than $78 billion at the end of 2013, an
increase of 83 percent.
Level 3 Assets
(in billions)
We have reduced our holdings of level 3, or
illiquid, assets by nearly 60 percent since the
first quarter of 2008 to $40 billion.
Gross Leverage
Our leverage ratio has fallen by more than
one-half from 26 times at the end of 2007 to
less than 12 times at the end of 2013.
GCE/Assets
Our excess liquidity pool (Global Core Excess),
as a percentage of our total assets, has
grown from more than 5 percent at the end
of 2007 to more than 20 percent in 2013.
2007 2013
11.6x
26.2x
1Q08 2013
$40
$96
2007 2013
20.2%
5.1%