General Dynamics 2010 Annual Report Download - page 3
Download and view the complete annual report
Please find page 3 of the 2010 General Dynamics annual report below. You can navigate through the pages in the report by either clicking on the pages listed below, or by using the keyword search tool below to find specific information within the annual report.-
 1
1 -
 2
2 -
 3
3 -
 4
4 -
 5
5 -
 6
6 -
 7
7 -
 8
8 -
 9
9 -
 10
10 -
 11
11 -
 12
12 -
 13
13 -
 14
14 -
15
-
16
-
17
-
18
-
19
-
20
-
21
-
22
-
23
-
24
-
25
-
26
-
27
-
28
-
29
-
30
-
31
-
32
-
33
-
34
-
35
-
36
-
37
-
38
-
39
-
40
-
41
-
42
-
43
-
44
-
45
-
46
-
47
-
48
-
49
-
50
-
51
-
52
-
53
-
54
-
55
-
56
-
57
-
58
-
59
-
60
-
61
-
62
-
63
-
64
-
65
-
66
-
67
-
68
-
69
-
70
-
71
-
72
-
73
-
74
-
75
-
76
-
77
-
78
-
79
-
80
-
81
-
82
-
83
-
84
-
85
-
86
-
87
-
88
-
89
-
90
-
91
-
92
-
93
-
94
-
95
-
96
 |
 |

This Annual Report contains forward-looking statements that are
based on management’s expectations, estimates, projections and
assumptions. Words such as “expects,” “anticipates,” “plans,”
“believes,” “scheduled,” “estimates,” “should” and variations
of these words and similar expressions are intended to identify
forward-looking statements. These include but are not limited to
projections of revenues, earnings, segment performance, cash
fl ows, contract awards, aircraft production, deliveries and backlog
stability. Forward-looking statements are made pursuant to the
safe-harbor provisions of the Private Securities Litigation Reform
Act of 1995, as amended. These statements are not guarantees of
future performance and involve certain risks and uncertainties that
are diffi cult to predict. Therefore, actual future results and trends
may diff er materially from what is forecast in forward-looking state-
ments due to a variety of factors, including, without limitation,
general U.S. and international political and economic conditions;
changing priorities in the U.S. government’s defense budget;
termination or restructuring of government contracts due to
unilateral government action; diff erences in anticipated and actual
program performance, including the ability to perform under long-
term fi xed-price contracts within estimated costs, and performance
issues with key suppliers and subcontractors; expected recovery
on contract claims and requests for equitable adjustment; changing
customer demand or preferences for business aircraft, including
the eff ects of economic conditions on the business-aircraft market;
potential for changing prices for energy and raw materials; and the
status or outcome of legal or regulatory proceedings.
All forward-looking statements speak only as of the date of this
report or, in the case of any document incorporated by reference,
the date of that document. All subsequent written and oral forward-
looking statements attributable to the company or any person
acting on the company’s behalf are qualifi ed by the cautionary
statements in this section. General Dynamics does not undertake
any obligation to update or publicly release any revisions to
forward-looking statements to refl ect events, circumstances or
changes in expectations after the date of this report.
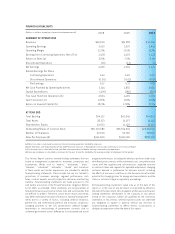
(Dollars in millions, except per share and employee amounts)
(a) Return on sales is calculated as earnings from continuing operations divided by revenues.
(b) See defi nitions and reconciliations of non-GAAP fi nancial measures in Management’s Discussion and Analysis in this Annual Report.
(c) Cash conversion is calculated as free cash fl ow from operations divided by earnings from continuing operations.
(d) Sales per employee is calculated as revenues for the past 12 months divided by the average number of employees for the period.
FINANCIAL HIGHLIGHTS
2008 2009 2010
SUMMARY OF OPERATIONS
Revenues $29,300 $31,981 $32,466
Operating Earnings 3,653 3,675 3,945
Operating Margin 12.5% 11.5% 12.2%
Earnings from Continuing Operations, Net of Tax 2,478 2,407 2,628
Return on Sales (a) 8.5% 7.5% 8.1%
Discontinued Operations (19) (13) (4)
Net Earnings 2,459 2,394 2,624
Diluted Earnings Per Share
Continuing Operations 6.22 6.20 6.82
Discontinued Operations (0.05) (0.03) (0.01)
Net Earnings 6.17 6.17 6.81
Net Cash Provided by Operating Activities 3,124 2,855 2,986
Capital Expenditures (490) (385) (370)
Free Cash Flow from Operations (b) 2,634 2,470 2,616
Cash Conversion (c) 106% 103% 100%
Return on Invested Capital (b) 18.5% 17.8% 17.5%
AT YEAR END
Total Backlog $74,127 $65,545 $59,561
Total Assets 28,373 31,077 32,545
Shareholders’ Equity 10,053 12,423 13,316
Outstanding Shares of Common Stock 386,710,589 385,704,691 372,052,313
Number of Employees 92,300 91,700 90,000
Sales Per Employee (d) $342,600 $346,500 $358,100