Fujitsu 2009 Annual Report Download - page 8
Download and view the complete annual report
Please find page 8 of the 2009 Fujitsu annual report below. You can navigate through the pages in the report by either clicking on the pages listed below, or by using the keyword search tool below to find specific information within the annual report.-
 1
1 -
 2
2 -
 3
3 -
 4
4 -
 5
5 -
 6
6 -
 7
7 -
 8
8 -
 9
9 -
 10
10 -
 11
11 -
 12
12 -
 13
13 -
 14
14 -
 15
15 -
 16
16 -
 17
17 -
 18
18 -
 19
19 -
20
-
21
-
22
-
23
-
24
-
25
-
26
-
27
-
28
-
29
-
30
-
31
-
32
-
33
-
34
-
35
-
36
-
37
-
38
-
39
-
40
-
41
-
42
-
43
-
44
-
45
-
46
-
47
-
48
-
49
-
50
-
51
-
52
-
53
-
54
-
55
-
56
-
57
-
58
-
59
-
60
-
61
-
62
-
63
-
64
-
65
-
66
-
67
-
68
-
69
-
70
-
71
-
72
-
73
-
74
-
75
-
76
-
77
-
78
-
79
-
80
-
81
-
82
-
83
-
84
-
85
-
86
-
87
-
88
-
89
-
90
-
91
-
92
-
93
-
94
-
95
-
96
-
97
-
98
-
99
-
100
-
101
-
102
-
103
-
104
-
105
-
106
-
107
-
108
-
109
-
110
-
111
-
112
-
113
-
114
-
115
-
116
-
117
-
118
-
119
-
120
-
121
-
122
-
123
-
124
-
125
-
126
-
127
-
128
-
129
-
130
-
131
-
132
-
133
-
134
 |
 |

4,766.8 4,692.9
5,330.8
5,100.1
4,791.4
4,762.7
29.1 32.0
36.1
35.8
33.2
29.9
2004 2005 2006 2007 2008 2009
0
2,000
4,000
6,000
0
20
40
60
150.3
3.2
68.7
3.8
1.5
3.6
3.8
3.4
204.9
182.0
181.4
160.1
2004 2005 2006 2007 2008 2009
0
100
200
300
0
3
6
9
3,865.5
0.64
3,221.9
1.03 0.98
0.93
0.88
0.71
3,821.9
3,943.7
3,807.1
3,640.1
2004 2005 2006 2007 2008 2009
0
1,000
3,000
5,000
4,000
2,000
0
0.4
0.8
2.0
1.6
1.2
827.1
21.4
748.9
24.8 23.2
24.6
24.1
23.5
948.2
969.5
917.0
856.9
2004 2005 2006 2007 2008 2009
0
300
900
1,200
600
0
10
40
30
20
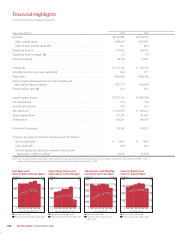
Fujitsu Limited and Consolidated Subsidiaries
Financial Highlights
(¥ Billions) (%) (¥ Billions) (%) (¥ Billions) (Times) (¥ Billions) (%)
Operating income (left scale)
Operating income margin (right scale)
Net sales (left scale)
Ratio of sales outside Japan (right scale)
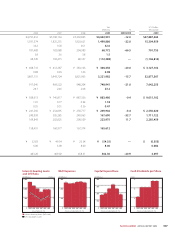
Total assets (left scale)
Monthly inventory turnover rate
(right scale)
Owners’ equity (left scale)
Owners’ equity ratio (right scale)
(Years ended March 31) (Years ended March 31) (As of March 31) (As of March 31)
Net Sales and
Ratio of Sales Outside Japan
Operating Income and
Operating Income Margin
Total Assets and Monthly
Inventory Turnover Rate
Owners’ Equity and
Owners’ Equity Ratio
Years ended March 31 2004 2005
Net sales . . . . . . . . . . . . . . . . . . . . . . . . . . . . . . . . . . . . . . . . . . . . . . . . . . . . . . . . . . . . . . . . . . . . . . . . . ¥4,766,888 ¥4,762,759
Sales outside Japan . . . . . . . . . . . . . . . . . . . . . . . . . . . . . . . . . . . . . . . . . . . . . . . . . . . . . . . . . . . . 1,388,623 1,422,095
Ratio of sales outside Japan (%) . . . . . . . . . . . . . . . . . . . . . . . . . . . . . . . . . . . . . . . . . . . . . . . . 29.1 29.9
Operating income . . . . . . . . . . . . . . . . . . . . . . . . . . . . . . . . . . . . . . . . . . . . . . . . . . . . . . . . . . . . . . . . 150,342 160,191
Operating income margin (%) . . . . . . . . . . . . . . . . . . . . . . . . . . . . . . . . . . . . . . . . . . . . . . . . . . . . 3.2 3.4
Net income (loss) . . . . . . . . . . . . . . . . . . . . . . . . . . . . . . . . . . . . . . . . . . . . . . . . . . . . . . . . . . . . . . . . . 49,704 31,907
Inventories . . . . . . . . . . . . . . . . . . . . . . . . . . . . . . . . . . . . . . . . . . . . . . . . . . . . . . . . . . . . . . . . . . . . . . . ¥ 521,126 ¥ 478,510
Monthly inventory turnover rate (times). . . . . . . . . . . . . . . . . . . . . . . . . . . . . . . . . . . . . . . . . . . 0.64 0.71
Total assets . . . . . . . . . . . . . . . . . . . . . . . . . . . . . . . . . . . . . . . . . . . . . . . . . . . . . . . . . . . . . . . . . . . . . . . 3,865,589 3,640,198
Owners’ equity (net assets less minority interests and
subscription rights to shares) . . . . . . . . . . . . . . . . . . . . . . . . . . . . . . . . . . . . . . . . . . . . . . . . . . . . 827,177 856,990
Owners’ equity ratio (%) . . . . . . . . . . . . . . . . . . . . . . . . . . . . . . . . . . . . . . . . . . . . . . . . . . . . . . . . . . . 21.4 23.5
Interest-bearing loans . . . . . . . . . . . . . . . . . . . . . . . . . . . . . . . . . . . . . . . . . . . . . . . . . . . . . . . . . . . . ¥1,277,121 ¥1,082,788
D/E ratio (times) . . . . . . . . . . . . . . . . . . . . . . . . . . . . . . . . . . . . . . . . . . . . . . . . . . . . . . . . . . . . . . . . . . 1.54 1.26
Net D/E ratio (times) . . . . . . . . . . . . . . . . . . . . . . . . . . . . . . . . . . . . . . . . . . . . . . . . . . . . . . . . . . . . . . 1.04 0.73
R&D expenses . . . . . . . . . . . . . . . . . . . . . . . . . . . . . . . . . . . . . . . . . . . . . . . . . . . . . . . . . . . . . . . . . . . . ¥ 250,910 ¥ 240,222
Capital expenditure . . . . . . . . . . . . . . . . . . . . . . . . . . . . . . . . . . . . . . . . . . . . . . . . . . . . . . . . . . . . . . . 159,795 181,402
Depreciation . . . . . . . . . . . . . . . . . . . . . . . . . . . . . . . . . . . . . . . . . . . . . . . . . . . . . . . . . . . . . . . . . . . . . 200,031 169,918
Number of employees . . . . . . . . . . . . . . . . . . . . . . . . . . . . . . . . . . . . . . . . . . . . . . . . . . . . . . . . . . . . 156,169 150,970
Amounts per share of common stock (yen and U.S. dollars):
Net income (loss) . . . . . . . . . . . . . . . . . . . . . . . . . . . . . . . . . . . . . . . . . . . . . . . . . . . . . . . . . . . . . . ¥ 24.55 ¥ 15.42
Cash dividends . . . . . . . . . . . . . . . . . . . . . . . . . . . . . . . . . . . . . . . . . . . . . . . . . . . . . . . . . . . . . . . . . 3.00 6.00
Owners’ equity (net assets less minority interests and
subscription rights to shares) . . . . . . . . . . . . . . . . . . . . . . . . . . . . . . . . . . . . . . . . . . . . . . . . . . 413.22 414.18
Note: The U.S. dollar amounts stated above and elsewhere in this report have been translated from yen, for readers’ convenience only, at the rate of ¥98 = US$1,
which was the approximate rate on the Tokyo Foreign Exchange Market on March 31, 2009.
006 ANNUAL REPORT 2009
FUJITSU LIMITED