Ford 2014 Annual Report Download - page 13
Download and view the complete annual report
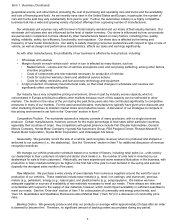
Please find page 13 of the 2014 Ford annual report below. You can navigate through the pages in the report by either clicking on the pages listed below, or by using the keyword search tool below to find specific information within the annual report.-
 1
1 -
2
-
 3
3 -
 4
4 -
 5
5 -
 6
6 -
 7
7 -
 8
8 -
 9
9 -
 10
10 -
 11
11 -
 12
12 -
 13
13 -
 14
14 -
 15
15 -
 16
16 -
 17
17 -
 18
18 -
 19
19 -
 20
20 -
 21
21 -
 22
22 -
 23
23 -
24
-
25
-
26
-
27
-
28
-
29
-
30
-
31
-
32
-
33
-
34
-
35
-
36
-
37
-
38
-
39
-
40
-
41
-
42
-
43
-
44
-
45
-
46
-
47
-
48
-
49
-
50
-
51
-
52
-
53
-
54
-
55
-
56
-
57
-
58
-
59
-
60
-
61
-
62
-
63
-
64
-
65
-
66
-
67
-
68
-
69
-
70
-
71
-
72
-
73
-
74
-
75
-
76
-
77
-
78
-
79
-
80
-
81
-
82
-
83
-
84
-
85
-
86
-
87
-
88
-
89
-
90
-
91
-
92
-
93
-
94
-
95
-
96
-
97
-
98
-
99
-
100
-
101
-
102
-
103
-
104
-
105
-
106
-
107
-
108
-
109
-
110
-
111
-
112
-
113
-
114
-
115
-
116
-
117
-
118
-
119
-
120
-
121
-
122
-
123
-
124
-
125
-
126
-
127
-
128
-
129
-
130
-
131
-
132
-
133
-
134
-
135
-
136
-
137
-
138
-
139
-
140
-
141
-
142
-
143
-
144
-
145
-
146
-
147
-
148
-
149
-
150
-
151
-
152
-
153
-
154
-
155
-
156
-
157
-
158
-
159
-
160
-
161
-
162
-
163
-
164
-
165
-
166
-
167
-
168
-
169
-
170
-
171
-
172
-
173
-
174
-
175
-
176
-
177
-
178
-
179
-
180
-
181
-
182
-
183
-
184
-
185
-
186
-
187
-
188
-
189
-
190
-
191
-
192
-
193
-
194
-
195
-
196
-
197
-
198
-
199
-
200
 |
 |

Item 1. Business (Continued)
Market Share
Our market share in each region and in certain key markets within each region during the past three years was as
follows:
Market Share (a)
2014 2013 2012
United States 14.7%15.7% 15.2%
Canada 15.5 15.9 16.1
Mexico 6.9 8.0 8.2
North America 14.2 15.2 14.8
Brazil 9.4% 9.4% 9.1%
Argentina 14.1 12.6 12.3
South America 8.9 8.9 8.6
Britain 14.5%14.6% 14.9%
Germany 7.1 6.9 6.8
Russia 2.6 3.8 4.3
Turkey 11.7 12.9 13.8
Europe (b) 7.2 7.3 7.4
Middle East & Africa 4.7% 5.0% 4.3%
China 4.5% 4.1% 3.2%
Australia 7.2 7.7 8.1
India 2.4 2.5 2.4
ASEAN 3.1 2.7 2.6
Asia Pacific (c) 3.5 3.3 2.6
Global 7.2% 7.3% 6.9%
______________
(a) Market share represents reported retail sales of our brands as a percent of total industry sales volume in the relevant market or region. Market
share is based, in part, on estimated vehicle registrations; includes medium and heavy trucks.
(b) Europe 20 market share was 8.0%, 7.8%, and 7.9% in 2014, 2013, and 2012, respectively.
(c) Asia Pacific market share includes Ford brand and JMC brand vehicles produced and sold by our unconsolidated affiliates.
7