Foot Locker 2010 Annual Report Download - page 62
Download and view the complete annual report
Please find page 62 of the 2010 Foot Locker annual report below. You can navigate through the pages in the report by either clicking on the pages listed below, or by using the keyword search tool below to find specific information within the annual report.-
 1
1 -
2
-
3
-
4
-
5
-
6
-
7
-
8
-
9
-
10
-
11
-
12
-
13
-
14
-
15
-
16
-
17
-
18
-
19
-
20
-
21
-
22
-
23
-
24
-
25
-
26
-
27
-
28
-
29
-
30
-
31
-
32
-
33
-
34
-
35
-
36
-
37
-
38
-
39
-
40
-
41
-
42
-
43
-
44
-
45
-
46
-
47
-
48
-
49
-
50
-
51
-
 52
52 -
 53
53 -
 54
54 -
 55
55 -
 56
56 -
 57
57 -
 58
58 -
 59
59 -
 60
60 -
 61
61 -
 62
62 -
 63
63 -
 64
64 -
 65
65 -
 66
66 -
 67
67 -
 68
68 -
 69
69 -
 70
70 -
 71
71 -
 72
72 -
73
-
74
-
75
-
76
-
77
-
78
-
79
-
80
-
81
-
82
-
83
-
84
-
85
-
86
-
87
-
88
-
89
-
90
-
91
-
92
-
93
-
94
-
95
-
96
-
97
-
98
-
99
-
100
-
101
-
102
-
103
-
104
 |
 |

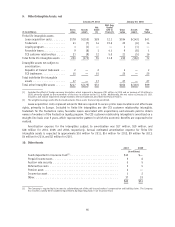
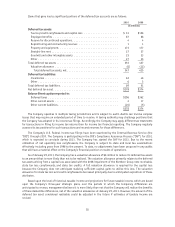
Depreciation and
Amortization Capital Expenditures Total Assets
2010 2009 2008 2010 2009 2008 2010 2009 2008
(in millions)
Athletic Stores..... $ 85 $ 90 $111 $72 $70 $122 $1,983 $1,873 $1,879
Direct-to-Customers . 9 9 6 4 5 6 290 291 297
94 99 117 76 75 128 2,273 2,164 2,176
Corporate ........ 12 13 13 21 14 18 623 652 701
Total Company..... $106 $112 $130 $97 $89 $146 $2,896 $2,816 $2,877
Sales and long-lived asset information by geographic area as of and for the fiscal years ended January 29,
2011, January 30, 2010, and January 31, 2009 are presented below. Sales are attributed to the country in which
the sales originate, which is where the legal subsidiary is domiciled. Long-lived assets reflect property and
equipment. The Company’s sales in Italy, Canada, and France represent approximately 24, 19, and 14 percent,
respectively, of the International category’s sales for the period ended January 29, 2011. No other individual
country included in the International category is significant.
2010 2009 2008
(in millions)
Sales
United States .......................................... $3,568 $3,425 $3,768
International .......................................... 1,481 1,429 1,469
Total sales ............................................ $5,049 $4,854 $5,237
2010 2009 2008
(in millions)
Long-Lived Assets
United States .......................................... $257 $266 $311
International .......................................... 129 121 121
Total long-lived assets .................................... $386 $387 $432
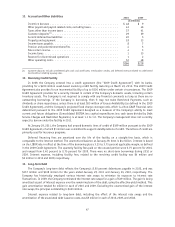
3. Impairment and Other Charges
2010 2009 2008
(in millions)
Impairment of goodwill and other intangible assets................. $10 $— $169
Impairment of assets ..................................... — 36 67
Reorganization costs ..................................... — 5 —
Store closing program .................................... — — 5
Money market impairment.................................. — — 3
Northern Group note impairment ............................. — — 15
Total impairment and other charges ........................... $10 $41 $259
Impairment of Goodwill and Other Intangible Assets
The 2010 and 2009 annual goodwill impairment tests did not result in an impairment charge as the fair
value of each reporting unit exceeded the carrying values of each respective reporting unit.
Intangible assets that are determined to have finite lives are amortized over their useful lives and are
measured for impairment only when events or circumstances indicate that the carrying value may be impaired.
Intangible assets with indefinite lives are tested for impairment if impairment indicators arise and, at a minimum,
annually. During the fourth quarter of 2010, the Company determined that a triggering event had occurred
related to its CCS intangible assets, which is part of the Direct-to-Customers segment, reflecting decreases in
projected revenues. Accordingly, a charge of $10 million was recorded to write-down the CCS tradename. The fair
value was determined using an income approach using the relief-from-royalty method.
43