Food Lion 2006 Annual Report Download - page 62
Download and view the complete annual report
Please find page 62 of the 2006 Food Lion annual report below. You can navigate through the pages in the report by either clicking on the pages listed below, or by using the keyword search tool below to find specific information within the annual report.-
 1
1 -
2
-
3
-
4
-
5
-
6
-
7
-
8
-
9
-
10
-
11
-
12
-
13
-
14
-
15
-
16
-
17
-
18
-
19
-
20
-
21
-
22
-
23
-
24
-
25
-
26
-
27
-
28
-
29
-
30
-
31
-
32
-
33
-
34
-
35
-
36
-
37
-
38
-
39
-
40
-
41
-
42
-
43
-
44
-
45
-
46
-
47
-
48
-
49
-
50
-
51
-
 52
52 -
 53
53 -
 54
54 -
 55
55 -
 56
56 -
 57
57 -
 58
58 -
 59
59 -
 60
60 -
 61
61 -
 62
62 -
 63
63 -
 64
64 -
 65
65 -
 66
66 -
 67
67 -
 68
68 -
 69
69 -
 70
70 -
 71
71 -
 72
72 -
73
-
74
-
75
-
76
-
77
-
78
-
79
-
80
-
81
-
82
-
83
-
84
-
85
-
86
-
87
-
88
-
89
-
90
-
91
-
92
-
93
-
94
-
95
-
96
-
97
-
98
-
99
-
100
-
101
-
102
-
103
-
104
-
105
-
106
-
107
-
108
-
109
-
110
-
111
-
112
-
113
-
114
-
115
-
116
 |
 |

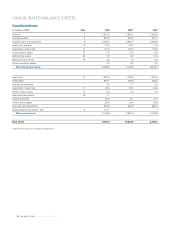
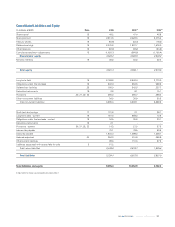
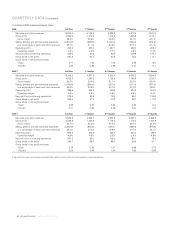
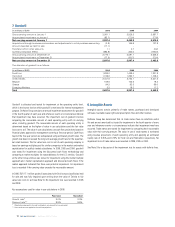
(in millions of EUR) Note 2006 2005
(1)
2004
(1)
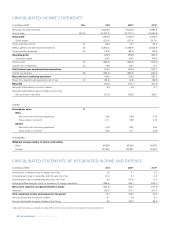
Net sales and other revenues 19,225.2 18,345.3 17,596.8
Cost of sales 29, 30 (14,372.2) (13,710.1) (13,250.9)
Gross profit 4,853.0 4,635.2 4,345.9
Gross margin 25.2% 25.3% 24.7%
Other operating income 31 82.8 70.7 66.2
Selling, general and administrative expenses 30 (3,970.3) (3,766.8) (3,522.9)
Other operating expenses 32 (19.2) (39.2) (27.0)
Operating profit 946.3 899.9 862.2
Operating margin 4.9% 4.9% 4.9%
Finance costs 33 (295.6) (322.6) (319.2)
Income from investments 34 19.9 26.1 14.7
Profit before taxes and discontinued operations 670.6 603.4 557.7
Income tax expense 25 (245.0) (223.8) (200.4)
Net profit from continuing operations 425.6 379.6 357.3
Result from discontinued operations (net of tax) 27 (65.3) (9.5) (55.5)
Net profit 360.3 370.1 301.8
Net profit attributable to minority interest 8.4 4.9 6.1
Net profit attributable to equity holders of the Group
(Group share in net profit) 351.9 365.2 295.7
(in EUR)
Earnings per share 26
Basic
Net profit from continuing operations 4.39 3.99 3.79
Group share in net profit 3.71 3.89 3.19
Diluted
Net profit from continuing operations 4.19 3.81 3.66
Group share in net profit 3.55 3.71 3.09
(in thousands)
Weighted average number of shares outstanding
Basic 94,939 93,934 92,663
Diluted 101,906 100,897 97,627
(in millions of EUR) 2006 2005
(1)
2004
(1)
Amortization of deferred loss on hedge, net of tax 3.2 4.1 4.3
Unrealized gain (loss) on securities held for sale, net of tax (0.1) 0.1 0.3
Actuarial gain (loss) on defined benefit plans, net of tax 9.9 (14.2) (3.7)
Exchange differences gain (loss) on translation of foreign operations (356.6) 435.1 (215.1)
Net income (expense) recognized directly in equity (343.6) 425.1 (214.2)
Net profit 360.3 370.1 301.8
Total recognized income and expense for the period 16.7 795.2 87.6
Amount attributable to minority interest 8.1 4.9 5.1
Amount attributable to equity holders of the Group 8.6 790.3 82.5
(1) Adjusted for the change in accounting policy described in Note 3 and for the reclassification of the Czech operations in discontinued operations
/ ANNUAL REPORT 2006
60