Food Lion 2006 Annual Report Download - page 103
Download and view the complete annual report
Please find page 103 of the 2006 Food Lion annual report below. You can navigate through the pages in the report by either clicking on the pages listed below, or by using the keyword search tool below to find specific information within the annual report.-
 1
1 -
2
-
3
-
4
-
5
-
6
-
7
-
8
-
9
-
10
-
11
-
12
-
13
-
14
-
15
-
16
-
17
-
18
-
19
-
20
-
21
-
22
-
23
-
24
-
25
-
26
-
27
-
28
-
29
-
30
-
31
-
32
-
33
-
34
-
35
-
36
-
37
-
38
-
39
-
40
-
41
-
42
-
43
-
44
-
45
-
46
-
47
-
48
-
49
-
50
-
51
-
52
-
53
-
54
-
55
-
56
-
57
-
58
-
59
-
60
-
61
-
62
-
63
-
64
-
65
-
66
-
67
-
68
-
69
-
70
-
71
-
72
-
73
-
74
-
75
-
76
-
77
-
78
-
79
-
80
-
81
-
82
-
83
-
84
-
85
-
86
-
87
-
88
-
89
-
90
-
91
-
92
-
 93
93 -
 94
94 -
 95
95 -
 96
96 -
 97
97 -
 98
98 -
 99
99 -
 100
100 -
 101
101 -
 102
102 -
 103
103 -
 104
104 -
 105
105 -
 106
106 -
 107
107 -
 108
108 -
 109
109 -
 110
110 -
 111
111 -
 112
112 -
 113
113 -
114
-
115
-
116
 |
 |

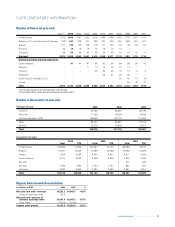
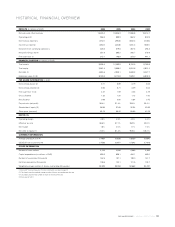
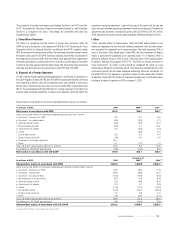
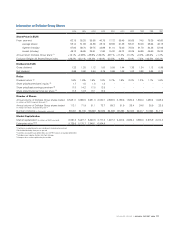
RESULTS (in millions of EUR) 2006 2005 2004 2003
Net sales and other revenues 19,225.2 18,345.3 17,596.8 18,214.7
Operating profit 946.3 899.9 862.2 800.9
Net financial expenses (275.7) (296.5) (304.5) (318.5)
Income tax expense (245.0) (223.8) (200.4) (188.1)
Net profit from continuing operations 425.6 379.6 357.3 294.3
Net profit (Group share) 351.9 365.2 295.7 278.9
Free cash flow (1) 215.1 148.9 373.0 441.1
FINANCIAL POSITION (in millions of EUR)
Total assets 9,295.4 10,253.9 8,702.5 8,765.8
Total equity 3,561.4 3,596.0 2,874.6 2,801.2
Net debt (1) 2,634.6 2,943.1 2,608.3 3,027.7
Enterprise value (1) (3) 8,725.9 8,170.8 7,849.1 6,804.9
PER SHARE INFORMATION (in EUR)
Net earnings (basic) (2) 3.71 3.89 3.19 3.03
Net earnings (diluted) (2) 3.55 3.71 3.09 3.02
Free cash flow (1) (2) 2.27 1.59 4.03 4.79
Gross dividend 1.32 1.20 1.12 1.00
Net dividend 0.99 0.90 0.84 0.75
Pay-out ratio (net profit) 36.4% 31.4% 35.5% 33.2%
Shareholders’ equity (3) 36.55 37.65 30.34 29.93
Share price (year-end) 63.15 55.20 55.95 40.78
RATIOS (%)
Operating margin 4.9% 4.9% 4.9% 4.4%
Effective tax rate 36.5% 37.1% 35.9% 39.0%
Net margin 1.8% 2.0% 1.7% 1.5%
Net debt to equity (1) 74.0% 81.4% 90.6% 108.1%
CURRENCY INFORMATION
Average USD/EUR rate (4) 0.7964 0.8038 0.8039 0.8840
USD/EUR rate at year-end (4) 0.7593 0.8477 0.7342 0.7918
OTHER INFORMATION
Number of sales outlets 2,705 2,636 2,565 2,559
Capital expenditures (in millions of EUR) 699.9 636.1 494.1 463.0
Number of associates (thousands) 142.5 137.1 138.0 141.7
Full-time equivalents (thousands) 106.6 102.1 101.5 104.7
Weighted average number of shares outstanding (thousands) 94,939 93,934 92,663 92,097
(1) Non-GAAP financial measures. For more information, see box on page 38.
(2) Calculated using the weighted average number of shares outstanding over the year.
(3) Calculated using the total number of shares at the end of the year.
(4) Euro value of USD 1.
/ ANNUAL REPORT 2006 101