Food Lion 2002 Annual Report Download - page 63
Download and view the complete annual report
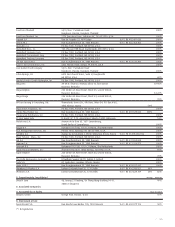
Please find page 63 of the 2002 Food Lion annual report below. You can navigate through the pages in the report by either clicking on the pages listed below, or by using the keyword search tool below to find specific information within the annual report.-
 1
1 -
2
-
3
-
4
-
5
-
6
-
7
-
8
-
9
-
10
-
11
-
12
-
13
-
14
-
15
-
16
-
17
-
18
-
19
-
20
-
21
-
22
-
23
-
24
-
25
-
26
-
27
-
28
-
29
-
30
-
31
-
32
-
33
-
34
-
35
-
36
-
37
-
38
-
39
-
40
-
41
-
42
-
43
-
44
-
45
-
46
-
47
-
48
-
49
-
50
-
51
-
52
-
 53
53 -
 54
54 -
 55
55 -
 56
56 -
 57
57 -
 58
58 -
 59
59 -
 60
60 -
 61
61 -
 62
62 -
 63
63 -
 64
64 -
 65
65 -
 66
66 -
 67
67 -
 68
68 -
 69
69 -
 70
70 -
 71
71 -
 72
72 -
 73
73 -
74
-
75
-
76
-
77
-
78
-
79
-
80
 |
 |

|61
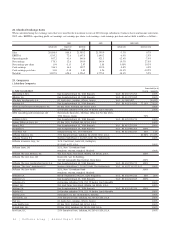
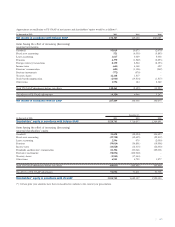
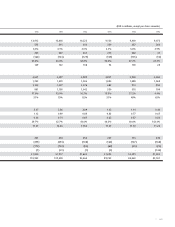
December 31,
(in thousands of EUR) 2002 2001 2000
Shareholders’ equity in accordance with Belgian GAAP 3,528,741 3,716,037 1,364,691
Items having the effect of increasing (decreasing)
reported shareholders’ equity:
Goodwill 21,698 (38,024)106,693
Fixed asset accounting (29,758) (32,695) (25,812)
Lease accounting 2,596 979 (2,050)
Pensions (50,014) (36,801) (19,906)
Income taxes (16,828) (16,315) (22,040)
Dividends and directors’ remuneration 81,306 133,046 125,038
Derivative instruments (78,054) (102,900) -
Treasury shares (5,942) (17,444) -
Other items 6,941 4,703 1,877
Total US GAAP adjustments before tax effects (68,055) (105,451) 163,800
Tax effects of US GAAP adjustments 94,056 71,611 21,708
Shareholders’ equity in accordance with US GAAP 3,554,742 3,682,197 1,550,199
Approximate reconciliation to US GAAP of net income and shareholders' equity would be as follows*:
(in thousands of EUR) 2002 2001 2000
Net income in accordance with Belgian GAAP 178,307 149,420 160,687
Items having the effect of increasing (decreasing)
reported net income:
Goodwill 95,019 10,673 (2,070)
Fixed asset accounting 521 (6,339) (5,893)
Lease accounting 1,617 3,029 5,002
Pensions 4,370 (1,569) (2,293)
Foreign currency transactions 8,130 2,504 (8,353)
Income taxes (641) 6,168 452
Directors’ remuneration (601) (1,106) (949)
Derivate instruments (772) (970) -
Treasury shares 12,168 1,517 -
Stock based compensation (2,946) (19,514) (1,517)
Other items 1,596 184 2,362
Total US GAAP adjustments before tax effects 118,461 (5,423) (13,259)
Tax effects of US GAAP adjustments (9,359) 4,049 3,247
Net income in accordance with US GAAP 287,409 148,046 150,675
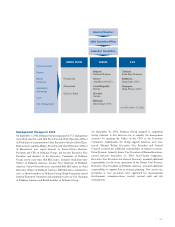
(*) Certain prior year amounts have been reclassified to conform to the current year presentation.