Food Lion 2002 Annual Report Download - page 43
Download and view the complete annual report
Please find page 43 of the 2002 Food Lion annual report below. You can navigate through the pages in the report by either clicking on the pages listed below, or by using the keyword search tool below to find specific information within the annual report.-
 1
1 -
2
-
3
-
4
-
5
-
6
-
7
-
8
-
9
-
10
-
11
-
12
-
13
-
14
-
15
-
16
-
17
-
18
-
19
-
20
-
21
-
22
-
23
-
24
-
25
-
26
-
27
-
28
-
29
-
30
-
31
-
32
-
 33
33 -
 34
34 -
 35
35 -
 36
36 -
 37
37 -
 38
38 -
 39
39 -
 40
40 -
 41
41 -
 42
42 -
 43
43 -
 44
44 -
 45
45 -
 46
46 -
 47
47 -
 48
48 -
 49
49 -
 50
50 -
 51
51 -
 52
52 -
 53
53 -
54
-
55
-
56
-
57
-
58
-
59
-
60
-
61
-
62
-
63
-
64
-
65
-
66
-
67
-
68
-
69
-
70
-
71
-
72
-
73
-
74
-
75
-
76
-
77
-
78
-
79
-
80
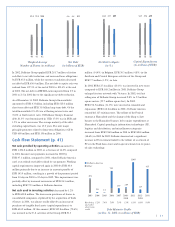
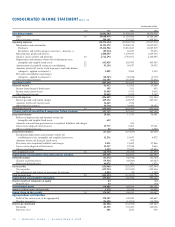
 |
 |

|41
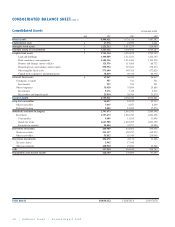
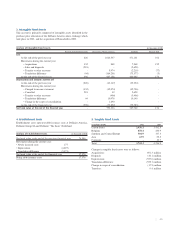
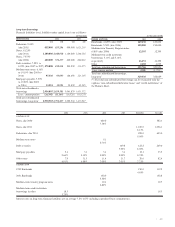
(in thousands of EUR)
Note 2002 2001 2000
Operating activities
27
Net income 178,307 149,420 160,687
Minority interest 1,578 19,338 95,495
Share in results of companies accounted for under the equity method (43) -80
Adjustments for
Depreciation and amortization 739,908 735,340 512,367
Provisions for losses on accounts receivable and inventory obsolescence 16,454 4,253 3,330
Stock option expenses 7,566 --
Income taxes 126,081 123,397 103,944
Interest expense and similar charges 429,132 445,295 282,132
Investment income (25,804) (9,904) (9,718)
Loss on disposal of fixed assets 11,437 12,558 2,636
Gain on disposal of fixed assets (13,737) (8,401) (37,961)
1,470,879 1,471,296 1,112,992
Changes in working capital requirement
Inventories (94,265) 87,221 88,747
Receivables (8,435) 72,734 (177,209)
Prepayements and accrued income 27,639 32,811 (33,186)
Trade payables 143,859 (47,318) (20,744)
Other payables 22,064 (36,813) 77,292
Accruals and deferred income (47,501) (38,494) (16,916)
Additions to provisions for liabilities and charges and deferred taxation 19,585 59,268 62,936
Cash generated from operations
1,533,825 1,600,705 1,093,912
Interest paid (375,316) (367,662) (268,979)
Income taxes paid (121,695) (24,557) (154,443)
Net cash provided by operating activities
1,036,814 1,208,486 670,490
Investing activities
27
Purchase of shares in consolidated companies, net of cash
and cash equivalents acquired (13,302) (69,950) (2,948,965)
Purchase of tangible fixed assets (634,901) (553,569) (544,717)
Purchase of intangible fixed assets (9,015) (12,720) (1,672)
Purchase of financial fixed assets (3,089) (4,488) (2,216)
Sale of shares in consolidated companies, net of cash
and cash equivalents divested -- 70,963
Sale of tangible and intangible fixed assets 35,400 24,593 94,192
Sale of financial fixed assets -- 688
Cash loans made (8,704) (9,838) (8,535)
Cash received from the repayment of loans 7,043 7,736 105
Dividends received 105 161 655
Interest received 25,699 9,743 9,062
Net cash used in investing activities
(600,764) (608,332) (3,330,440)
Cash flow before financing activities
436,050 600,154 (2,659,950)
Financing activities
27
Proceeds from the exercise of share warrants -8,007 660
Borrowings under long-term loans 6,822 3,075,398 17,150
Direct financing costs -(31,330) -
Repayment of long-term loans (127,067) (209,275) (93,258)
Borrowings under short-term loans (> three months) 202,666 473,967 371,799
Repayment under short-term loans (> three months) (186,876) (502,237) (557,134)
Additions to (repayments of) short-term loans (< three months) (100,957) (2,864,167) 2,888,683
Dividends and directors’ share of profit (134,529) (125,905) (65,427)
Dividends paid by subsidiaries to minority interests (1,295) (18,448) (51,779)
Increase in capital of subsidiaries by minority interests -193 -
Proceeds upon conversion of stock option at a subsidiary 4,849 8,980 4,858
Purchases of treasury shares (13,357) (36,243) -
Loss on rate-lock related to long-term bond -(239,027) -
Net cash provided by (used in) financing activities
(349,744) (460,087) 2,515,552
Effect of foreign exchange translation differences (53,296) 9,398 14,458
Change of the scope of consolidation -1,390 -
Net increase (decrease) in cash and cash equivalents
33,010 150,855 (129,940)
Cash and cash equivalents - Beginning of the year 384,730 233,875 363,815
Cash and cash equivalents - End of the year 417,740 384,730 233,875
Cash and short-term investments (excl. treasury shares) 417,740 391,854 273,135
Bank overdrafts payable on demand -(7,124) (39,260)
Cash and cash equivalents, as reported 417,740 384,730 233,875
CONSOLIDATED STATEMENT OF CASH FLOWS (note 1)