Food Lion 2002 Annual Report Download - page 42
Download and view the complete annual report
Please find page 42 of the 2002 Food Lion annual report below. You can navigate through the pages in the report by either clicking on the pages listed below, or by using the keyword search tool below to find specific information within the annual report.-
 1
1 -
2
-
3
-
4
-
5
-
6
-
7
-
8
-
9
-
10
-
11
-
12
-
13
-
14
-
15
-
16
-
17
-
18
-
19
-
20
-
21
-
22
-
23
-
24
-
25
-
26
-
27
-
28
-
29
-
30
-
31
-
 32
32 -
 33
33 -
 34
34 -
 35
35 -
 36
36 -
 37
37 -
 38
38 -
 39
39 -
 40
40 -
 41
41 -
 42
42 -
 43
43 -
 44
44 -
 45
45 -
 46
46 -
 47
47 -
 48
48 -
 49
49 -
 50
50 -
 51
51 -
 52
52 -
53
-
54
-
55
-
56
-
57
-
58
-
59
-
60
-
61
-
62
-
63
-
64
-
65
-
66
-
67
-
68
-
69
-
70
-
71
-
72
-
73
-
74
-
75
-
76
-
77
-
78
-
79
-
80
 |
 |

40 |Delhaize Group |Annual Report 2002
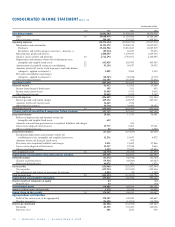
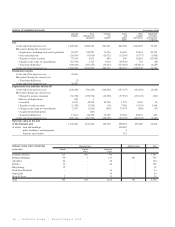
CONSOLIDATED INCOME STATEMENT (note 1, 18)
(in thousands of EUR)
Note 2002 2001 2000
Operating income 21,082,584 21,920,023 18,576,729
Sales 19 20,688,436 21,395,945 18,168,166
Other operating income 394,148 524,078 408,563
Operating expenses (20,275,394) (20,998,720) (17,837,216)
Merchandise and consumables 15,323,270 15,968,370 13,695,993
Purchases 15,412,504 15,881,843 13,605,519
Inventories and work in progress (increase –, decrease +) (89,234) 86,527 90,474
Miscellaneous goods and services 1,408,495 1,439,853 1,239,784
Salaries, social security and pensions 20 2,712,294 2,783,011 2,328,085
Depreciation and amounts written off establishment costs,
intangible and tangible fixed assets 22 632,828 629,436 465,563
Amortization of goodwill arising on consolidation 22 92,154 89,957 39,932
Amounts written off stocks, work in progress and trade debtors
(charged +, applied or released –) 3,809 2,264 3,330
Provisions for liabilities and charges
(charged +, applied or released –) (18,563) (30,226) (6,715)
Other operating expenses 121,107 116,055 71,244
Operating profit 807,190 921,303 739,513
Financial income 41,422 15,242 15,060
Income from financial fixed assets 105 161 655
Income from current assets 25,699 9,743 9,063
Other financial income 15,618 5,338 5,342
Financial expenses (496,487) (479,504) (311,284)
Interest payable and similar charges 429,132 445,295 282,132
Amounts written off current assets 12,645 1,514 -
Other financial expenses 54,710 32,695 29,152
Net financial result 23 (455,065) (464,262) (296,224)
Current profit of consolidated companies before taxation 352,125 457,041 443,289
Exceptional income 14,391 11,379 38,961
Release of depreciation and amounts written off
intangible and tangible fixed assets 632 --
Amounts released from provisions for exceptional liabilities and charges -343 -
Gains on the disposal of fixed assets 13,737 8,401 37,961
Other exceptional income 22 2,635 1,000
Exceptional expenses (27,121) (107,829) (80,260)
Exceptional depreciation and amounts written off
establishment costs, intangible and tangible fixed assets 11,531 15,947 6,872
Amounts written off financial fixed assets -475 -
Provisions for exceptional liabilities and charges 2,831 21,402 27,866
Losses on the disposal of fixed assets 11,437 12,558 2,636
Other exceptional expenses 1,322 57,447 42,886
Net exceptional result 24 (12,730) (96,450) (41,299)
Profit of the consolidated companies before taxation 339,395 360,591 401,990
Deferred taxation (33,472) (68,436) (41,784)
Transfer to deferred taxes (79,551) (69,029) (43,607)
Release of deferred taxes 46,079 593 1,823
Tax on profits (126,081) (123,397) (103,944)
Tax on profits (127,935) (123,452) (105,046)
Tax adjustments and release of provisions for taxation 1,854 55 1,102
Total income taxes 25 (159,553) (191,833) (145,728)
Profit of the consolidated companies 179,842 168,758 256,262
Share in results of companies at equity 43 -(80)
Profit/(Loss) 43 -(80)
Consolidated profit 179,885 168,758 256,182
Interest of third parties in the results 1,578 19,338 95,495
Group share in the results 26 178,307 149,420 160,687
Appropriations and transfers
Profit of the current year to be appropriated 178,307 149,420 160,687
Transfer to reserves (96,401) (14,891) (34,700)
Profit to be distributed (81,906) (134,529) (125,987)
Dividends 81,305 133,423 125,038
Directors’ fees 601 1,106 949