Famous Footwear 2012 Annual Report Download - page 6
Download and view the complete annual report
Please find page 6 of the 2012 Famous Footwear annual report below. You can navigate through the pages in the report by either clicking on the pages listed below, or by using the keyword search tool below to find specific information within the annual report.-
 1
1 -
 2
2 -
 3
3 -
 4
4 -
 5
5 -
 6
6 -
 7
7 -
 8
8 -
 9
9 -
 10
10 -
 11
11 -
 12
12 -
 13
13 -
 14
14 -
 15
15 -
 16
16 -
 17
17 -
18
-
19
-
20
-
21
-
22
-
23
-
24
-
25
-
26
-
27
-
28
-
29
-
30
-
31
-
32
-
33
-
34
-
35
-
36
-
37
-
38
-
39
-
40
-
41
-
42
-
43
-
44
-
45
-
46
-
47
-
48
-
49
-
50
-
51
-
52
-
53
-
54
-
55
-
56
-
57
-
58
-
59
-
60
-
61
-
62
-
63
-
64
-
65
-
66
-
67
-
68
-
69
-
70
-
71
-
72
-
73
-
74
-
75
-
76
-
77
-
78
-
79
-
80
-
81
-
82
-
83
-
84
-
85
-
86
-
87
-
88
-
89
-
90
-
91
-
92
-
93
-
94
-
95
-
96
 |
 |

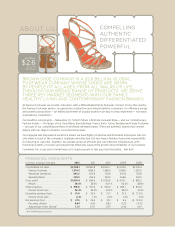
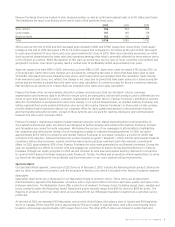
4 2012 BROWN SHOE COMPANY ANNUAL REPORT
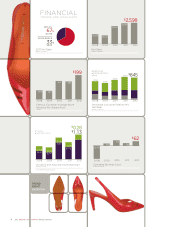
2012 Net Sales
dollars in millions
WHOLESALE
$845
RETAIL
$1,753
67%
33%
Famous Footwear Average Store
Revenue Per Square Foot
dollars
$199
$186
$187
$167
$168
$62
($173)
$32
$73
$36
Operating Earnings (Loss)
dollars in millions
Wholesale Consumer Platform Mix
Net Sales
dollars in millions
Contemporary Fashion
Healthy Living
Other $
845
$871
$754
$632
$704
2008 2009 2010 2011 2012
Net Sales
dollars in millions
$2,598
$2,276 $2,242
$2,504
$2,583
2008 2009 2010 2011 2012
2008 2009 2010 2011 2012
2008 2009 2010 2011 2012
Dividends and Adjusted Diluted Earnings*
dollars per share
* Non-GAAP financial measure
2008 2009 2010 2011 2012
$
1
.13
$
0
.
28
Dividends
Adjusted EPS, diluted
$0.47
$0.28
$0.40
$0.28
$0.97
$0.28
$0.70
$0.28
TREND
RIGHT
EVERYDAY
FINANCIAL
TRENDS AND HIGHLIGHTS