Duke Energy 2008 Annual Report Download - page 4
Download and view the complete annual report
Please find page 4 of the 2008 Duke Energy annual report below. You can navigate through the pages in the report by either clicking on the pages listed below, or by using the keyword search tool below to find specific information within the annual report.-
 1
1 -
 2
2 -
 3
3 -
 4
4 -
 5
5 -
 6
6 -
 7
7 -
 8
8 -
 9
9 -
 10
10 -
 11
11 -
 12
12 -
 13
13 -
 14
14 -
 15
15 -
16
-
17
-
18
-
19
-
20
-
21
-
22
-
23
-
24
-
25
-
26
-
27
-
28
-
29
-
30
-
31
-
32
-
33
-
34
-
35
-
36
 |
 |

2 Duke Energy 2 Duke Energy 2 Duke Energy
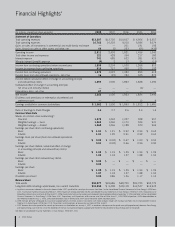
Financial Highlightsa
(In millions, except per-share amounts) 2008 2007 2006 2005 2004
Statement of Operations
Total operating revenues $13,207 $12,720 $10,607 $ 6,906 $ 6,357
Total operating expenses 10,765 10,222 9,210 5,586 5,074
Gains on sales of investments in commercial and multi-family real estate — — 201 191 192
Gains (losses) on sales of other assets and other, net 69 (5) 223 (55) (435)
Operating income 2,511 2,493 1,821 1,456 1,040
Total other income and expenses 121 428 354 217 180
Interest expense 741 685 632 381 425
Minority interest (benefit) expense (4) 2 13 24 (15)
Income from continuing operations before income taxes 1,895 2,234 1,530 1,268 810
Income tax expense from continuing operations 616 712 450 375 192
Income from continuing operations 1,279 1,522 1,080 893 618
Income (loss) from discontinued operations, net of tax 16 (22) 783 935 872
Income before cumulative effect of change in accounting principle
and extraordinary items 1,295 1,500 1,863 1,828 1,490
Cumulative effect of change in accounting principle,
net of tax and minority interest — — — (4) —
Extraordinary items, net of tax 67 — — — —
Net income 1,362 1,500 1,863 1,824 1,490
Dividends and premiums on redemption of preferred and
preference stock — — — 12 9
Earnings available for common stockholders $ 1,362 $ 1,500 $ 1,863 $ 1,812 $ 1,481
Ratio of Earnings to Fixed Charges 3.4 3.7 2.6 2.4 1.6
Common Stock Data
Shares of common stock outstanding b
Year-end 1,272 1,262 1,257 928 957
Weighted average — basic 1,265 1,260 1,170 934 931
Weighted average — diluted 1,268 1,266 1,188 970 966
Earnings per share (from continuing operations)
Basic $ 1.01 $ 1.21 $ 0.92 $ 0.94 $ 0.65
Diluted 1.01 1.20 0.91 0.92 0.64
Earnings (loss) per share (from discontinued operations)
Basic $ 0.02 $ (0.02) $ 0.67 $ 1.00 $ 0.94
Diluted 0.01 (0.02) 0.66 0.96 0.90
Earnings per share (before cumulative effect of change
in accounting principle and extraordinary items)
Basic $ 1.03 $ 1.19 $ 1.59 $ 1.94 $ 1.59
Diluted 1.02 1.18 1.57 1.88 1.54
Earnings per share (from extraordinary items)
Basic $ 0.05 $ — $ — $ — $ —
Diluted 0.05 — — — —
Earnings per share
Basic $ 1.08 $ 1.19 $ 1.59 $ 1.94 $ 1.59
Diluted 1.07 1.18 1.57 1.88 1.54
Dividends per share c 0.90 0.86 1.26 1.17 1.10
Balance Sheet
Total assets $53,077 $49,686 $68,700 $54,723 $55,770
Long-term debt including capital leases, less current maturities $13,250 $ 9,498 $18,118 $14,547 $16,932
a Significant transactions reflected in the results above include: 2007 spinoff of the natural gas businesses (see Note 1 to the Consolidated Financial Statements in Duke Energy’s 2008 Form
10-K, “Summary of Significant Accounting Policies”), 2006 merger with Cinergy (see Note 3 to the Consolidated Financial Statements in Duke Energy’s 2008 Form 10-K, “Acquisitions and
Dispositions of Businesses and Sales of Other Assets”), 2006 Crescent joint venture transaction and subsequent deconsolidation effective September 7, 2006 (see Note 3 to the Consolidated
Financial Statements in Duke Energy’s 2008 Form 10-K, “Acquisitions and Dispositions of Businesses and Sales of Other Assets”), 2005 DENA disposition, 2005 deconsolidation of
DCP Midstream effective July 1, 2005, 2005 DCP Midstream sale of TEPPCO and 2004 sale of the former DENA Southeast plants.
b 2006 increase primarily attributable to issuance of approximately 313 million shares in connection with Duke Energy’s merger with Cinergy (see Note 3 to the Consolidated Financial
Statements in Duke Energy’s 2008 Form 10-K, “Acquisitions and Dispositions of Businesses and Sales of Other Assets”).
c 2007 decrease due to the spinoff of the natural gas businesses to shareholders on January 2, 2007, as dividends subsequent to the spinoff were split proportionately between Duke Energy
and Spectra Energy such that the sum of the dividends of the two stand-alone companies approximated the former total dividend of Duke Energy prior to the spinoff.
See Notes to Consolidated Financial Statements in Duke Energy’s 2008 Form 10-K.