Creative 2002 Annual Report Download - page 16
Download and view the complete annual report
Please find page 16 of the 2002 Creative annual report below. You can navigate through the pages in the report by either clicking on the pages listed below, or by using the keyword search tool below to find specific information within the annual report.-
 1
1 -
2
-
3
-
4
-
5
-
 6
6 -
 7
7 -
 8
8 -
 9
9 -
 10
10 -
 11
11 -
 12
12 -
 13
13 -
 14
14 -
 15
15 -
 16
16 -
 17
17 -
 18
18 -
 19
19 -
 20
20 -
 21
21 -
 22
22 -
 23
23 -
 24
24 -
 25
25 -
 26
26 -
27
-
28
-
29
-
30
-
31
-
32
-
33
-
34
-
35
-
36
-
37
-
38
-
39
-
40
-
41
-
42
-
43
-
44
-
45
-
46
-
47
-
48
-
49
-
50
-
51
-
52
-
53
-
54
-
55
-
56
 |
 |

14
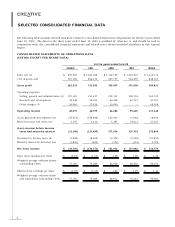
QUARTERLY RESULTS
The following is a summary of Creative’s unaudited quarterly results for the eight quarters ended June 30, 2002, together
with the percentage of sales represented by such results. Consistent with the PC peripheral market, demand for Creative’s
products is generally stronger in the quarter ended December 31, compared to any other quarter of the fiscal year due
to consumer buying patterns. In management’s opinion, the results detailed below have been prepared on a basis
consistent with the audited financial statements and include all adjustments, consisting only of normal recurring adjustments,
necessary for a fair presentation of the information for the periods presented when read in conjunction with the financial
statements and notes thereto contained elsewhere herein. Creative’s business is seasonal in nature and the quarterly
results are not necessarily indicative of the results to be achieved in future quarters.
Unaudited data for quarters ended (in US$’000 except per share data)
Jun 30 Mar 31 Dec 31 Sep 30 Jun 30 Mar 31 Dec 31 Sep 30
2002 2002 2001 2001 2001 2001 2000 2000
Sales, net (1) $ 182,572 $ 193,385 $ 249,506 $ 180,442 $ 233,315 $ 262,009 $ 426,576 $ 304,168
Cost of goods sold 122,291 129,209 167,353 124,529 170,211 199,622 313,069 211,334
Gross profit 60,281 64,176 82,153 55,913 63,104 62,387 113,507 92,834
Operating expenses:
Selling, general and
administrative (1) 42,815 38,737 45,143 43,427 48,237 54,664 69,614 57,902
Research and development 10,748 8,412 9,480 9,608 12,431 11,380 15,115 15,096
Other charges (2) 26,080 ––––22,814––
Operating (loss) income (19,362) 17,027 27,530 2,878 2,436 (26,471) 28,778 19,836
Net (loss) gain from investments (29,845) 128 728 (16,425) (75,988) (75,360) 507 2,351
Interest income (expense)
and other, net 2,289 151 1,291 1,424 183 1,090 2,055 (912)
(Loss) income before income
taxes and minority interest (46,918) 17,306 29,549 (12,123) (73,369) (100,741) 31,340 21,275
Provision for income taxes (1,012) (1,703) (2,753) (230) – – (4,624) (3,785)
Minority interest in
(income) loss (436) (423) (489) (495) (71) (289) (241) 132
Net (loss) income $ (48,366) $ 15,180 $ 26,307 $ (12,848) $ (73,440) $(101,030) $ 26,475 $ 17,622
Basic (loss) earnings per share $ (0.65) $ 0.21 $ 0.36 $ (0.17) $ (0.94) $ (1.27) $ 0.34 $ 0.22
Weighted average ordinary
shares outstanding (’000) 74,375 72,134 72,366 73,854 78,084 79,299 78,964 79,848
Diluted (loss) earnings per share $ (0.65) $ 0.20 $ 0.36 $ (0.17) $ (0.94) $ (1.27) $ 0.33 $ 0.21
Weighted average ordinary
shares and equivalents
outstanding (’000) 74,375 76,323 73,664 73,854 78,084 79,299 81,180 84,151
MANAGEMENT’S DISCUSSION AND ANALYSIS OF
FINANCIAL CONDITION AND RESULTS OF OPERATIONS