Creative 2000 Annual Report Download - page 9
Download and view the complete annual report
Please find page 9 of the 2000 Creative annual report below. You can navigate through the pages in the report by either clicking on the pages listed below, or by using the keyword search tool below to find specific information within the annual report.-
 1
1 -
 2
2 -
 3
3 -
 4
4 -
 5
5 -
 6
6 -
 7
7 -
 8
8 -
 9
9 -
 10
10 -
 11
11 -
 12
12 -
 13
13 -
 14
14 -
 15
15 -
 16
16 -
 17
17 -
 18
18 -
 19
19 -
 20
20 -
21
-
22
-
23
-
24
-
25
-
26
-
27
-
28
-
29
-
30
-
31
-
32
-
33
-
34
-
35
-
36
-
37
-
38
-
39
-
40
-
41
-
42
-
43
-
44
 |
 |

9
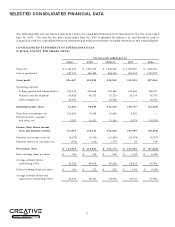
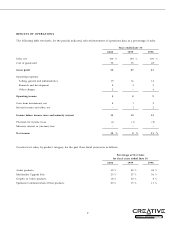
RESULTS OF OPERATIONS
The following table sets forth, for the periods indicated, selected statement of operations data as a percentage of sales:
Years ended June 30
2000 1999 1998
Sales, net 100 % 100 % 100 %
Cost of goods sold 70 73 69
Gross profit 30 27 31
Operating expenses:
Selling, general and administrative 19 16 13
Research and development 4 3 3
Other charges 2 – 6
Operating income 5 8 9
Gain from investments, net 8 1 2
Interest income and other, net – 1 2
Income before income taxes and minority interest 13 10 13
Provision for income taxes (1) (1) (2)
Minority interest in (income) loss – – –
Net income 12 % 9 % 11 %
Creative’s net sales, by product category, for the past three fiscal years were as follows:
Percentage of Net Sales
for fiscal years ended June 30
2000 1999 1998
Audio products 39 % 38 % 45 %
Multimedia Upgrade Kits 23 % 27 % 36 %
Graphic & Video products 18 % 20 % 8 %
Speakers/ Communication/ Other products 20 % 15 % 11 %