Creative 2000 Annual Report Download - page 11
Download and view the complete annual report
Please find page 11 of the 2000 Creative annual report below. You can navigate through the pages in the report by either clicking on the pages listed below, or by using the keyword search tool below to find specific information within the annual report.-
 1
1 -
 2
2 -
 3
3 -
 4
4 -
 5
5 -
 6
6 -
 7
7 -
 8
8 -
 9
9 -
 10
10 -
 11
11 -
 12
12 -
 13
13 -
 14
14 -
 15
15 -
 16
16 -
 17
17 -
 18
18 -
 19
19 -
 20
20 -
 21
21 -
 22
22 -
23
-
24
-
25
-
26
-
27
-
28
-
29
-
30
-
31
-
32
-
33
-
34
-
35
-
36
-
37
-
38
-
39
-
40
-
41
-
42
-
43
-
44
 |
 |

11
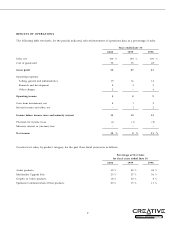
YEAR ENDED JUNE 30, 1999 COMPARED TO YEAR ENDED JUNE 30, 1998
Net sales in fiscal 1999 increased by $62.3 million or 5% compared to fiscal 1998. This increase in sales was primarily due
to an increase in sales of graphics and speakers products. During fiscal 1999, audio sales (Sound Blaster audio cards and
chipsets) decreased by 13%, compared to fiscal 1998, and represented 38% of total sales, compared to 45% in fiscal 1998.
This decrease in sales was due to a decline in average selling prices in particular lower end audio cards. Sales of multimedia
upgrade kits (“MMUK”) decreased by 21% in fiscal 1999, and represented 27% of sales, compared to 36% in fiscal 1998.
The reduction in MMUK sales was due mainly to declining average selling prices, adverse market conditions in Asia and
Latin America and the shortage of DVD drives during the first two quarters of fiscal 1999. Nonetheless, sales recovered in
the second half of fiscal 1999 due to increased availability of DVD drives from Creative’s vendors. Sales of video and graphics
products increased by 169% in fiscal 1999 and represented 20% of total sales, compared to fiscal 1998, when they represented
8% of total sales. This increase was primarily attributable to an increase in sales of Creative’s new graphics cards that were
introduced in fiscal 1999. Sales of other products including speakers increased by 45% to 15% of total sales in fiscal 1999,
compared to 11% in fiscal 1998. Speaker sales represented 7% of sales in fiscal 1999, compared with 3% in fiscal 1998.
Gross profit decreased by 9% in fiscal 1999 and represented 27% of sales, compared to 31% in fiscal 1998. This decrease
in gross profit percentage was largely attributable to a decline in average selling prices of audio products and unfavorable
product mix. In addition, the increase in overall revenue contribution of lower margin video and graphic products has led
to a decline in the gross profit margin during fiscal 1999.
Selling, general and administrative expenses increased to 16% of sales in fiscal 1999, compared to 13% of sales in fiscal 1998.
This increase was primarily due to a full year amortization of intangibles arising from acquisitions in fiscal 1998 (see Note
15 of “Notes to Consolidated Financial Statements”), marketing programs for Sound Blaster Live! and an increase in
marketing and advertising expenses incurred in launching other new products. Research and development expenses in fiscal
1999 remained flat at 3% of sales, compared to the prior year.
Included in the results of fiscal 1998 were other charges of $68.6 million. This related to three acquisitions recorded under
the purchase method of accounting, resulting in an aggregate write off of acquired in-process technology of $60.3 million
(see Note 15 of “Notes to Consolidated Financial Statements”) and a one-time charge of $8.3 million for the cessation of
certain activities.
For fiscal 1999, net gain from investments was $15.0 million, compared to $18.5 million in 1998. Interest and other income
for fiscal 1999 decreased by $6.5 million compared to fiscal 1998, due to a decline in interest income resulting from a lower
average cash balance.
Creative’s effective tax rate decreased from 13% in fiscal 1998 to 8% in fiscal 1999. The decrease is primarily attributable
to decreased profitability; the mix of income arising from various geographical regions, where the tax rates range from 0%
to 50%; pioneer status income from Singapore, which is exempt from tax; and utilization of non-Singapore net operating
losses. The pioneer status had the effect of reducing Creative’s provision for income taxes by approximately $26.4 million
or $0.29 per share and $43.3 million or $0.46 per share, for fiscal 1999 and 1998, respectively.