Creative 2000 Annual Report Download - page 10
Download and view the complete annual report
Please find page 10 of the 2000 Creative annual report below. You can navigate through the pages in the report by either clicking on the pages listed below, or by using the keyword search tool below to find specific information within the annual report.-
 1
1 -
 2
2 -
 3
3 -
 4
4 -
 5
5 -
 6
6 -
 7
7 -
 8
8 -
 9
9 -
 10
10 -
 11
11 -
 12
12 -
 13
13 -
 14
14 -
 15
15 -
 16
16 -
 17
17 -
 18
18 -
 19
19 -
 20
20 -
 21
21 -
22
-
23
-
24
-
25
-
26
-
27
-
28
-
29
-
30
-
31
-
32
-
33
-
34
-
35
-
36
-
37
-
38
-
39
-
40
-
41
-
42
-
43
-
44
 |
 |

10
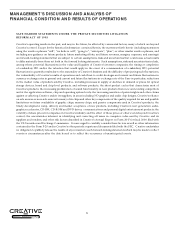
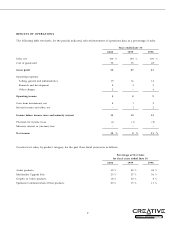
MANAGEMENT’S DISCUSSION AND ANALYSIS OF
FINANCIAL CONDITION AND RESULTS OF OPERATIONS
YEAR ENDED JUNE 30, 2000 COMPARED TO YEAR ENDED JUNE 30, 1999
Net sales for the year ended June 30, 2000 increased by 4%, compared to the year ended June 30, 1999. Audio product
sales (Sound Blaster audio cards and chipsets) increased by 6% and represented 39% of sales in fiscal year 2000, compared
to 38% of sales in the prior fiscal year. This improvement was primarily due to an increase in sales of Sound Blaster Live!
and Sound Blaster PCI sound cards. Sales of multimedia upgrade kits, including data storage, decreased by 13% in fiscal year
2000 and represented 23% of sales, compared to 27% of sales in the prior fiscal year. This reduction in sales was primarily
due to a decline in sales of multimedia upgrade kits, DVD drives, and CD-ROM drives, offset in part by increased sales of
CD-RW (Compact Disk ReWritable) drives. Sales of DVD drives declined primarily due to component shortages while the
decline in sales of CD-ROM drives was primarily due to reductions in average selling prices. Sales of video and graphics
products including digital cameras, decreased by 7% and represented 18% of sales in fiscal year 2000, compared with fiscal
year 1999, when they represented 20% of sales. This decrease in sales was primarily attributable to component shortages
for the high-end 3D Blaster products, and the phase out of low-end graphics and video cards. The decline in sales of video
and graphics products was offset in part by an increase in sales of digital cameras. Sales of speakers increased by 65% and
represented 11% of sales in fiscal 2000, compared with fiscal 1999, when they represented 7% of sales. This improvement
in speaker sales was a result of strong growth in the sales of multimedia speakers as a result of broader market acceptance.
Sales of other products, which included accessories, music products, digital music players, communication products and other
miscellaneous items, increased by 18% and represented 9% of sales in fiscal 2000, compared to 8% of sales in the prior fiscal
year. This increase in other product sales was primarily due to an increase in sales of digital music players and communication
products.
Gross profit in fiscal 2000 improved by 13% compared to fiscal 1999. As a percentage of sales, gross margin for fiscal 2000
was 30% as compared to 27% in the prior year. This improvement in gross margin was primarily attributable to a favorable
product mix, resulting from increased sales of higher margin products such as Sound Blaster Live!, Sound Blaster PCI and
multimedia speakers. Although Creative has experienced sequential improvement in quarterly gross margin percentages in
fiscal 2000, there can be no assurance that these improvements in the overall gross margin percentages will continue or that
Creative can maintain such gross margin percentages in the future.
Selling, general and administrative expenses during fiscal 2000 increased to 19% of sales, compared to 16% of sales in fiscal
1999. This increase was primarily due to expenses incurred to develop and promote Creative’s internet businesses which
accounts for about 4% of sales. Creative’s research and development (“R&D”) expenses increased to 4% of sales in fiscal
2000, compared to 3% of sales in the prior year, primarily due to an increase in expenditures on the development of a new
range of products.
Included in the results of fiscal 2000 were other charges of $20.0 million relating to the settlement of all outstanding
litigation claims between Aureal and Creative, see Notes 13 and 14 of “Notes to Consolidated Financial Statements.”
In fiscal 2000, Creative’s net gain from investments was $103.4 million, compared to $15.0 million in fiscal 1999. This
included $84.9 million net gain from investments and $18.5 million gain from an increase in the value of marketable equity
securities. Net interest and other income decreased by $9.3 million to $5.3 million in fiscal 2000, compared to $14.6 million
in the prior fiscal year. This decline was primarily a result of a reduction in interest income arising from a lower average cash
balance during the period and an adverse impact of foreign currency exchange rate fluctuations.
Creative’s provision for income taxes for fiscal 2000 remained flat at 1% of sales as compared to the prior fiscal year. The
provision for income taxes as a percentage of income before taxes and minority interest excluding net gain from investments
increased from 9% in fiscal 1999, to 14% in fiscal 2000. The increase was primarily due to a change in the mix of taxable
income arising from various geographical regions, where the tax rates range from 0% to 50%. Creative’s Pioneer Certificate
expired in March 2000. Creative has applied for a separate and new Pioneer Certificate covering a new range of products.
If Creative is awarded this new Pioneer Certificate, profits from qualified products under the new Pioneer Certificate will
be exempted from tax in Singapore. The Singapore corporate income tax rate of 25.5% will be applicable to the profits of
products excluded from the new Pioneer Certificate. In the event that Creative fails to obtain the new Pioneer Certificate,
future taxable income in Singapore shall be subjected to a statutory tax rate of 25.5%. There can be no assurance Creative
will be awarded a new Pioneer Certificate, or, if awarded, the rate may be higher than historical experience.