Cracker Barrel 2008 Annual Report Download - page 6
Download and view the complete annual report
Please find page 6 of the 2008 Cracker Barrel annual report below. You can navigate through the pages in the report by either clicking on the pages listed below, or by using the keyword search tool below to find specific information within the annual report.-
 1
1 -
 2
2 -
 3
3 -
 4
4 -
 5
5 -
 6
6 -
 7
7 -
 8
8 -
 9
9 -
 10
10 -
 11
11 -
 12
12 -
 13
13 -
 14
14 -
 15
15 -
 16
16 -
 17
17 -
18
-
19
-
20
-
21
-
22
-
23
-
24
-
25
-
26
-
27
-
28
-
29
-
30
-
31
-
32
-
33
-
34
-
35
-
36
-
37
-
38
-
39
-
40
-
41
-
42
-
43
-
44
-
45
-
46
-
47
-
48
-
49
-
50
-
51
-
52
-
53
-
54
-
55
-
56
-
57
-
58
-
59
-
60
-
61
-
62
-
63
-
64
-
65
-
66
-
67
-
68
-
69
-
70
-
71
-
72
-
73
-
74
-
75
-
76
-
77
-
78
-
79
-
80
-
81
-
82
 |
 |

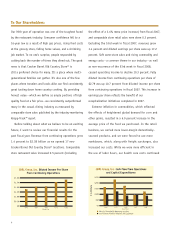
Our 39th year of operation was one of the toughest faced
by the restaurant industry.Consumer confidence fell to a
16-year low as a result of high gas prices, rising food costs
at the grocery store, fallinghome values, and a shrinking
job market. To no one’s surprise,people responded by
cuttingback the number of times they dined out. The good
news is that Cracker Barrel Old Country Store®is
still a preferred choice formany.It’s a place wheremulti-
generational families can gather.It’s also one of the few
places wheretravelers and locals alike can find consistently
great tastingdown homecountry cooking. By providing
honest value –which we define as ample portions of high
quality food at a fair price –we consistently outperformed
many in the casual dining industry as measured by
comparable storesales published by the industry-monitoring
Knapp-Track™report.
Before talking about what we believe to be an exciting
future, I want to review our financialresults for the
past fiscal year. Revenue from continuing operations grew
1.4 percent to $2.38 billion as we opened 17 new
Cracker Barrel Old Country Store®locations. Comparable
storerestaurant sales increased 0.5 percent (including
theeffect of a 3.6% menupriceincrease) from fiscal 2007,
andcomparable storeretail sales were down 0.3 percent.
Excluding the 53rd week in fiscal 2007, revenues grew
3.4 percentanddiluted earnings per share were up 17.2
percent. Softsame-storesales and rising commodity and
energy costs–acommon themein our industry –as well
as non-recurrence of the 53rdweek in fiscal 2008,
caused operating income to decline10.3 percent. Fully
diluted incomefrom continuingoperationsper share of
$2.79 was up 10.7 percentfrom diluted income per share
from continuingoperations in fiscal 2007. This increase in
earnings per share reflects the benefit of our
recapitalization initiatives completed in 2007.
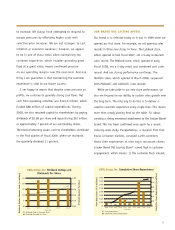
Extreme inflation in commodities,which reflected
theeffects of heightenedglobal demand for corn and
other grains, resulted in a 6.0 percent increase in the
average price of thefood we purchased.In the retail
business, we carried more lower-margin domestically-
sourced products, andwe were forced to use more
markdowns, which, along with freight surcharges,also
increased our costs. While we were moreefficient in
theuse of labor hours,our health care costs continued