Comfort Inn 2011 Annual Report Download - page 17
Download and view the complete annual report
Please find page 17 of the 2011 Comfort Inn annual report below. You can navigate through the pages in the report by either clicking on the pages listed below, or by using the keyword search tool below to find specific information within the annual report.-
 1
1 -
2
-
3
-
4
-
5
-
6
-
 7
7 -
 8
8 -
 9
9 -
 10
10 -
 11
11 -
 12
12 -
 13
13 -
 14
14 -
 15
15 -
 16
16 -
 17
17 -
 18
18 -
 19
19 -
 20
20 -
 21
21 -
 22
22 -
 23
23 -
 24
24 -
 25
25 -
 26
26 -
 27
27 -
28
-
29
-
30
-
31
-
32
-
33
-
34
-
35
-
36
-
37
-
38
-
39
-
40
-
41
-
42
-
43
-
44
-
45
-
46
-
47
-
48
-
49
-
50
-
51
-
52
-
53
-
54
-
55
-
56
-
57
-
58
-
59
-
60
-
61
-
62
-
63
-
64
-
65
-
66
-
67
-
68
-
69
-
70
-
71
-
72
-
73
-
74
-
75
-
76
-
77
-
78
-
79
-
80
-
81
-
82
-
83
-
84
-
85
-
86
-
87
-
88
-
89
-
90
-
91
-
92
-
93
-
94
-
95
-
96
-
97
-
98
-
99
-
100
-
101
-
102
-
103
-
104
-
105
-
106
-
107
-
108
-
109
-
110
-
111
-
112
-
113
-
114
-
115
-
116
-
117
-
118
-
119
-
120
-
121
-
122
-
123
 |
 |

Table of Contents
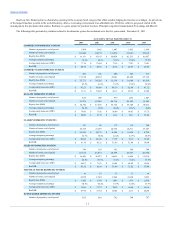
The following table presents key worldwide system size statistics as of and for the year ended December 31, 2011:
Comfort 1,953
149,752
94
6,894
76
(21)
(88)
Comfort
Suites 628
49,379
98
7,263
13
(1)
(19)
Quality 1,417
129,701
58
4,596
100
16
(88)
Ascend
Collection 63
6,120
15
1,466
22
—
(1)
Clarion 327
45,245
25
3,916
38
(3)
(28)
Sleep Inn 404
29,654
56
3,555
8
(4)
(8)
MainStay
Suites 42
3,311
31
2,445
5
—
(1)
Econo Lodge 872
52,801
33
1,992
65
1
(42)
Rodeway Inn 391
21,742
24
1,436
25
12
(35)
Suburban 62
7,285
25
2,136
4
—
(6)
Cambria
Suites 19
2,215
31
3,976
—
—
(4)
Totals 6,178
497,205
490
39,675
356
—
(320)
Brand growth is important to our business model. We have identified key market areas for hotel development based on supply/demand relationships
and our strategic objectives. Development opportunities are typically offered to: (i) existing franchisees; (ii) developers of hotels; (iii) owners of independent
hotels and motels; (iv) owners of hotels leaving other franchisors’ brands; and, (v) franchisees of non-hotel related products such as restaurants.
Our franchise sales organization is structured to support the Company’s efforts to leverage its core strengths in order to take advantage of opportunities
for further growth. The franchise sales organization employs both sales managers as well as franchise sales directors. This organization emphasizes the
benefits of affiliating with the Choice system, our commitment to improving hotel profitability, our central reservation delivery services, our training and
support systems (including our proprietary property management systems) and our Company’s track record of growth and profitability to potential
franchisees. Franchise sales directors are assigned to specific brands to leverage their brand expertise to enhance product consistency and deal flow. Our sales
managers ensure each prospective hotel is placed in the appropriate brand, facilitate teamwork and information sharing amongst the sales directors and
provide better service to our potential franchisees. The structure of this organization supports the Company’s efforts to leverage its core strengths in order to
take advantage of opportunities for further growth. Integrating our brands and strategies allow our brand teams to focus on understanding, anticipating and
meeting the unique needs of our customers.
Our objective is to continue to grow our portfolio by continuing to sell our existing brands, creating extensions of our existing brands and introducing
new brands, either organically or via acquisition, within the various lodging chain categories. Based on market conditions and other circumstances, we may
offer certain incentives to developers to increase development of our brands such as discounting various fees such as the initial franchise fee and royalty rates
as well as provide financing for property improvements and other purposes.
Because retention of existing franchisees is important to our growth strategy, we have a formal impact policy. This policy offers existing franchisees
protection from the opening of a same-brand property within a specified distance, depending upon the market in which the property is located.
Our board of directors previously authorized us to enter into programs which permit us to offer financing, investment, and guaranty support to
qualified franchisees as well as to acquire and resell real estate to incent franchise development for certain brands in strategic markets. We expect to
opportunistically deploy capital over the next several years and our annual investment in these programs will be dependent on market and other conditions.
16