Comfort Inn 2011 Annual Report Download - page 12
Download and view the complete annual report
Please find page 12 of the 2011 Comfort Inn annual report below. You can navigate through the pages in the report by either clicking on the pages listed below, or by using the keyword search tool below to find specific information within the annual report.-
 1
1 -
 2
2 -
 3
3 -
 4
4 -
 5
5 -
 6
6 -
 7
7 -
 8
8 -
 9
9 -
 10
10 -
 11
11 -
 12
12 -
 13
13 -
 14
14 -
 15
15 -
 16
16 -
 17
17 -
 18
18 -
 19
19 -
 20
20 -
 21
21 -
 22
22 -
23
-
24
-
25
-
26
-
27
-
28
-
29
-
30
-
31
-
32
-
33
-
34
-
35
-
36
-
37
-
38
-
39
-
40
-
41
-
42
-
43
-
44
-
45
-
46
-
47
-
48
-
49
-
50
-
51
-
52
-
53
-
54
-
55
-
56
-
57
-
58
-
59
-
60
-
61
-
62
-
63
-
64
-
65
-
66
-
67
-
68
-
69
-
70
-
71
-
72
-
73
-
74
-
75
-
76
-
77
-
78
-
79
-
80
-
81
-
82
-
83
-
84
-
85
-
86
-
87
-
88
-
89
-
90
-
91
-
92
-
93
-
94
-
95
-
96
-
97
-
98
-
99
-
100
-
101
-
102
-
103
-
104
-
105
-
106
-
107
-
108
-
109
-
110
-
111
-
112
-
113
-
114
-
115
-
116
-
117
-
118
-
119
-
120
-
121
-
122
-
123
 |
 |

Table of Contents
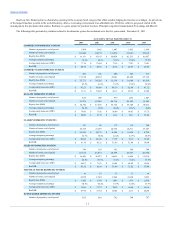
Number of rooms, end of period 50,403
50,812
48,996
48,728
49,483
Royalty fees ($000) $17,266
$17,400
$15,025
$15,068
$15,655
Average occupancy percentage 48.0%
46.9%
43.5%
45.8%
47.5%
Average daily room rate (ADR) $54.40
$55.58
$54.66
$54.10
$54.71
RevPAR $26.10
$26.05
$23.78
$24.80
$25.96
Number of properties, end of period 276
346
372
387
388
Number of rooms, end of period 16,523
20,302
21,392
21,261
21,627
Royalty fees ($000) $2,865
$3,397
$3,819
$4,257
$4,541
Average occupancy percentage 47.6%
47.5%
43.0%
45.8%
48.7%
Average daily room rate (ADR) $53.24
$55.04
$52.48
$51.07
$51.87
RevPAR $25.32
$26.16
$22.54
$23.38
$25.27
Number of properties, end of period 54
60
61
64
60
Number of rooms, end of period 6,773
7,256
7,416
7,685
7,126
Royalty fees ($000) $2,535
$2,444
$2,275
$2,353
$2,537
Average occupancy percentage 67.3%
62.4%
56.3%
63.8%
67.5%
Average daily room rate (ADR) $40.13
$42.93
$41.51
$39.23
$40.26
RevPAR $27.01
$26.80
$23.35
$25.03
$27.15
Number of properties, end of period 4
12
18
23
19
Number of rooms, end of period 459
1,323
2,073
2,700
2,215
Royalty fees ($000) $41
$ 374
$920
$1,447
$2,022
Average occupancy percentage(2)
—
—
—
—
—
Average daily room rate (ADR)(2)
—
—
—
—
—
RevPAR(2)
—
—
—
—
—
Number of properties, end of period —
21
28
38
52
Number of rooms, end of period —
1,353
2,346
3,025
4,617
Royalty fees ($000) —
$ 93
$ 679
$1,129
$1,655
Average occupancy percentage(2)
—
—
49.4%
57.6%
60.3%
Average daily room rate (ADR)(2)
—
—
$115.97
$112.50
$113.59
RevPAR(2)
—
—
$57.24
$64.81
$68.44
____________________________
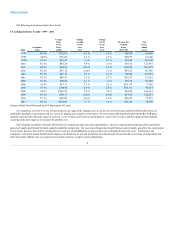
(1) Statistics for the Clarion brand reflect the repositioning of 20 units in the fourth quarter of 2008 and 1 unit in the first quarter of 2009 from the Clarion brand to the Ascend
Collection.
(2) Statistics for average occupancy percentage, ADR and RevPAR have been excluded for years in which the brand did not have at least 25 units open and operating.
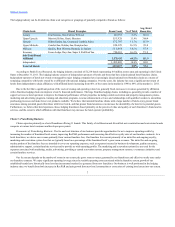
The Company conducts its international franchise operations through a combination of direct franchising and master franchising relationships. Master
franchising relationships are governed by master franchising agreements which generally provide the master franchisee with the right to use our brands in a
specific geographic region, usually for a fee.
Our business philosophy has been to conduct direct franchising in those international markets where both franchising is an accepted business model
and we believe our brands can achieve significant distribution. We typically elect to enter into master franchise agreements in those markets where direct
franchising is currently not a prevalent or viable business model. When entering into master franchising relationships, we strive to select partners that have
professional hotel and asset management capabilities together with the financial capacity to invest in building the Choice brands in their respective markets.
Master franchising relationships typically provide lower revenues to the Company as the master franchisees are responsible for managing certain necessary
services (such as training, quality assurance, reservations and marketing) to support the franchised hotels in the master franchise area and therefore retain a
larger percentage of the hotel franchise fees to cover their expenses. In certain circumstances, the Company has and may continue to make equity investments
in our master franchisees.
As a result of our use of master franchising relationships and international market conditions, total revenues from international franchising operations
comprised 9% and 8% of our total revenues in 2011 and 2010, respectively while