Cincinnati Bell 2003 Annual Report Download - page 23
Download and view the complete annual report
Please find page 23 of the 2003 Cincinnati Bell annual report below. You can navigate through the pages in the report by either clicking on the pages listed below, or by using the keyword search tool below to find specific information within the annual report.-
 1
1 -
2
-
3
-
4
-
5
-
6
-
7
-
8
-
9
-
10
-
11
-
12
-
 13
13 -
 14
14 -
 15
15 -
 16
16 -
 17
17 -
 18
18 -
 19
19 -
 20
20 -
 21
21 -
 22
22 -
 23
23 -
 24
24 -
 25
25 -
 26
26 -
 27
27 -
 28
28
 |
 |
21
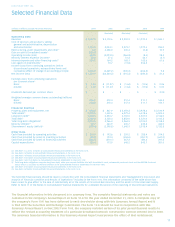
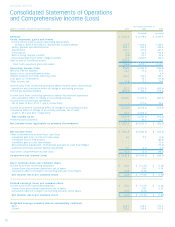
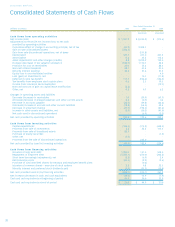
Business Segment Information
Cincinnati Bell Inc.
$ Change % Change $ Change % Change
2003 2003 2002 2002
(Dollars in Millions) 2003 2002 vs. 2002 vs. 2002 2001 vs. 2001 vs. 2001
(Restated)
Local Revenue
Local service $ 466.4 $ 468.1 $ (1.7) - $ 465.3 $ 2.8 1 %
Network access 202.4 204.1 (1.7) (1)% 205.3 (1.2) (1)%
Other services 151.6 160.9 (9.3) (6)% 154.1 6.8 4 %
Total revenue 820.4 833.1 (12.7) (2)% 824.7 8.4 1 %
Operating costs and expenses:
Cost of services and products 260.0 261.8 (1.8) (1)% 271.1 (9.3) (3)%
Selling, general and administrative 133.5 139.5 (6.0) (4)% 134.7 4.8 4 %
Depreciation 125.7 146.7 (21.0) (14)% 140.3 6.4 5 %
Restructuring 4.5 (0.5) 5.0 n/m 12.1 (12.6) n/m
Asset impairments and other charges 0.6 0.3 0.3 100 % - 0.3 n/m
Total operating costs and expenses 524.3 547.8 (23.5) (4)% 558.2 (10.4) (2)%
Operating income $ 296.1 $ 285.3 $ 10.8 4 % $ 266.5 $ 18.8 7 %
Operation margin 36.1 % 34.2 % +2 pts 32.3 % +2 pts
Wireless Revenue
Service $ 246.4 $ 253.3 $ (6.9) (3)% $ 239.0 $ 14.3 6 %
Equipment 13.1 13.9 (0.8) (6)% 15.4 (1.5) (10)%
Total revenue 259.5 267.2 (7.7) (3)% 254.4 12.8 5 %
Operating costs and expenses:
Cost of services and products 110.5 119.5 (9.0) (8)% 131.5 (12.0) (9)%
Selling, general and administrative 50.0 47.3 2.7 6 % 56.9 (9.6) (17)%
Depreciation 38.3 30.6 7.7 25 % 25.3 5.3 21 %
Amortization 0.5 0.7 (0.2) (29)% 3.0 (2.3) (77)%
Total operating costs and expenses 199.3 198.1 1.2 1 % 216.7 (18.6) (9)%
Operating income (loss) $ 60.2 $ 69.1 $ (8.9) (13)% $ 37.7 $ 31.4 83 %
Operating margin 23.2 % 25.9 % (3) pts 14.8 % +11 pts
Other Revenue $ 81.1 $ 82.8 $ (1.7) (2)% $ 79.0 $ 3.8 5 %
Operating costs and expenses:
Cost of services and products 54.1 63.4 (9.3) (15)% 58.8 4.6 8 %
Selling, general and administrative 14.8 15.8 (1.0) (7)% 21.6 (5.8) (27)%
Depreciation 2.0 1.8 0.2 11 % 1.8 - -
Amortization 0.1 0.1 - - - 0.1 100 %
Restructuring - - - n/m 0.5 (0.5) n/m
Asset impairments and other charges 3.6 - 3.6 n/m - - n/m
Total operating costs and expenses 74.6 81.1 (6.5) (8)% 82.7 (1.6) (2)%
Operating income (loss) 6.5 1.7 4.8 n/m (3.7) 5.4 n/m
Operating margin 8.0 %2.1 % +6 pts (4.7)% +7 pts
Broadband Revenue
IT consulting $ 95.3 $ 143.7 $ (48.4) (34)% $ 141.3 $ 2.4 2 %
Broadband transport 159.3 461.6 (302.3) (65)% 466.5 (4.9) (1)%
Switched voice services 111.9 335.9 (224.0) (67)% 383.1 (47.2) (12)%
Data and Internet 80.5 132.9 (52.4) (39)% 121.9 11.0 9 %
Network construction
and other services 1.7 1.3 0.4 31 % 56.8 (55.5) (98)%
Total revenue 448.7 1,075.4 (626.7) (58)% 1,169.6 (94.2) (8)%
Costs,expenses, gains and losses:
Cost of services and products 296.2 655.6 (359.4) (55)% 775.3 (119.7) (15)%
Selling, general and administrative 144.5 308.3 (163.8) (53)% 332.2 (23.9) (7)%
Depreciation 2.5 291.1 (288.6) (99)%273.4 17.7 6 %
Amortization - 24.8 (24.8) (100)% 110.7 (85.9) (78)%
Restructuring (11.0) 32.6 (43.6) n/m 73.9 (41.3) (56)%
Asset impairments and other charges 4.6 2,200.6 (2,196.0) n/m 152.0 2,048.6 n/m
Gain on sale of broadband assets (336.7) - (336.7) n/m - - n/m
Total costs,expenses,gains and losses 100.1 3,513.0 (3,412.9) (97)% 1,717.5 1,795.5 n/m
Operating income (loss) $ 348.6 $(2,437.6) $ 2,786.2 n/m $ (547.9) (1,889.7) n/m
Operating margin 77.7 % n/m n/m (46.8)% n/m