Charles Schwab 2015 Annual Report Download - page 9
Download and view the complete annual report
Please find page 9 of the 2015 Charles Schwab annual report below. You can navigate through the pages in the report by either clicking on the pages listed below, or by using the keyword search tool below to find specific information within the annual report.-
 1
1 -
 2
2 -
 3
3 -
 4
4 -
 5
5 -
 6
6 -
 7
7 -
 8
8 -
 9
9 -
 10
10 -
 11
11 -
 12
12 -
 13
13 -
 14
14 -
 15
15 -
 16
16 -
 17
17 -
 18
18 -
 19
19 -
 20
20 -
21
-
22
-
23
-
24
-
25
-
26
-
27
-
28
-
29
-
30
-
31
-
32
-
33
-
34
-
35
-
36
-
37
-
38
-
39
-
40
-
41
-
42
-
43
-
44
-
45
-
46
-
47
-
48
-
49
-
50
-
51
-
52
-
53
-
54
-
55
-
56
-
57
-
58
-
59
-
60
-
61
-
62
-
63
-
64
-
65
-
66
-
67
-
68
-
69
-
70
-
71
-
72
-
73
-
74
-
75
-
76
-
77
-
78
-
79
-
80
-
81
-
82
-
83
-
84
-
85
-
86
-
87
-
88
-
89
-
90
-
91
-
92
-
93
-
94
-
95
-
96
-
97
-
98
-
99
-
100
-
101
-
102
-
103
-
104
-
105
-
106
-
107
-
108
-
109
-
110
-
111
-
112
-
113
-
114
-
115
-
116
-
117
-
118
-
119
-
120
-
121
-
122
-
123
-
124
-
125
-
126
-
127
-
128
-
129
-
130
-
131
-
132
-
133
-
134
-
135
-
136
-
137
-
138
-
139
-
140
-
141
-
142
-
143
-
144
-
145
-
146
-
147
-
148
-
149
-
150
 |
 |

7
LETTER FROM THE CHIEF EXECUTIVE OFFICER
Poised for growth
Most economists project modest growth in GDP over
the next ve to 10 years. As a result, top-line growth for
companies is also likely to be challenging. But at Schwab,
we are incredibly optimistic about our ability to generate
substantial growth.
First, if interest rates rise over the next few years, we could
scale back the previously mentioned waivers of money
market fund management fees, and if longer-term rates
do not decline precipitously, we could also earn a more
reasonable return on clients’ short-term cash investments
on our balance sheet.
Second, over the coming years we would be able to invest
some portion of this incremental revenue in initiatives that
should power our net new asset and client growth, which
leads to organic revenue growth. These investments are
likely to lead to some combination of more retail branches,
more nancial consultants who work with clients daily,
enhanced technology that makes it easier for clients to
invest and save with us,
targeted pricing moves that
deliver even better value to
our clients, and even higher
levels of service than the
award-winning service we
deliver today.
Growth matters–to both our
clients and our stockholders.
For clients, growth means
we build scale, and with
greater scale comes greater
efciency. And with greater
efciency we can deliver
even greater value to clients.
This is another example of a
virtuous cycle. Our company
already operates more
efciently, by a wide margin,
than any publicly traded
investment services rm.
And we plan to leverage this
efciency to grow even more.
For stockholders, growth
creates value. Using the
simple example of supply
and demand, we know that
people will pay more for
what is scarce. Putting this
in terms of an investor trying
to decide whether to invest
in Schwab stock or the stock
of some other company, the
anticipation of protable
revenue growth can be the
deciding factor. And with
top-line revenue growth likely
to be scarce in the coming
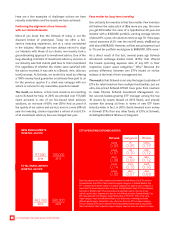
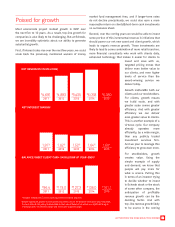
Despite signicant growth in client assets and client cash on the balance sheet since year-end 2008,
the zero interest rate policy implemented by the Federal Reserve has acted as a signicant drag on
revenue growth, net interest margin and net income (opposite page).
*Includes Schwab One® certain cash equivalents and bank deposits
BALANCE SHEET CLIENT CASH (IN BILLIONS AT YEAR-END)*
$44.4
2008
$96.4
2011
$119.0
2012
$127.3
2013
$136.0
2014
$161.1
2015
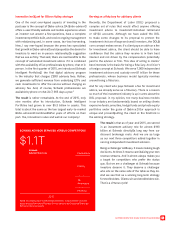
$5,15 0
2008
$4,691
2011
$4,883
2012
$5,435
2013
$6,058
2014
$6,380
2015
NET REVENUES (IN MILLIONS)
NET INTEREST MARGIN
3.84%
2008
1.81%
2011
1.62%
2012
1.52%
2013
1.64%
2014
1.60%
2015
,