Charles Schwab 2015 Annual Report Download - page 16
Download and view the complete annual report
Please find page 16 of the 2015 Charles Schwab annual report below. You can navigate through the pages in the report by either clicking on the pages listed below, or by using the keyword search tool below to find specific information within the annual report.-
 1
1 -
2
-
3
-
4
-
5
-
 6
6 -
 7
7 -
 8
8 -
 9
9 -
 10
10 -
 11
11 -
 12
12 -
 13
13 -
 14
14 -
 15
15 -
 16
16 -
 17
17 -
 18
18 -
 19
19 -
 20
20 -
 21
21 -
 22
22 -
 23
23 -
 24
24 -
 25
25 -
 26
26 -
27
-
28
-
29
-
30
-
31
-
32
-
33
-
34
-
35
-
36
-
37
-
38
-
39
-
40
-
41
-
42
-
43
-
44
-
45
-
46
-
47
-
48
-
49
-
50
-
51
-
52
-
53
-
54
-
55
-
56
-
57
-
58
-
59
-
60
-
61
-
62
-
63
-
64
-
65
-
66
-
67
-
68
-
69
-
70
-
71
-
72
-
73
-
74
-
75
-
76
-
77
-
78
-
79
-
80
-
81
-
82
-
83
-
84
-
85
-
86
-
87
-
88
-
89
-
90
-
91
-
92
-
93
-
94
-
95
-
96
-
97
-
98
-
99
-
100
-
101
-
102
-
103
-
104
-
105
-
106
-
107
-
108
-
109
-
110
-
111
-
112
-
113
-
114
-
115
-
116
-
117
-
118
-
119
-
120
-
121
-
122
-
123
-
124
-
125
-
126
-
127
-
128
-
129
-
130
-
131
-
132
-
133
-
134
-
135
-
136
-
137
-
138
-
139
-
140
-
141
-
142
-
143
-
144
-
145
-
146
-
147
-
148
-
149
-
150
 |
 |

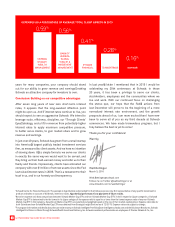
14 FINANCIAL HIGHLIGHTS
FINANCIAL HIGHLIGHTS
GROWTH RATE
1-YEAR
(In Millions, Except Per Share Amounts and As Noted) 2014–15 2015 2014 2013
Net revenues 5% $ 6,380 $ 6,058 $ 5,435
Expenses excluding interest 4% $ 4,101 $ 3,943 $ 3,730
Net income available to common stockholders 8% $ 1,364 $ 1,261 $ 1,010
Basic earnings per common share 8% $ 1.04 $ .96 $ .78
Diluted earnings per common share 8% $ 1.03 $ .95 $ .78
Dividends declared per common share — $ .24 $ .24 $ .24
Weighted-average common shares outstanding—diluted 1% 1,327 1,315 1,293
Closing market price per share (at year-end) 9% $ 32.93 $ 30.19 $ 26.00
Book value per common share (at year-end) 9% $ 9.05 $ 8.34 $ 7.33
Net revenue growth 5% 11% 11%
Pre-tax prot margin 35.7% 34.9% 31.4%
Return on average common stockholders’ equity 12% 12% 11%
Full-time equivalent employees (at year-end, in thousands) 5% 15.3 14.6 13.8