Charles Schwab 2015 Annual Report Download - page 14
Download and view the complete annual report
Please find page 14 of the 2015 Charles Schwab annual report below. You can navigate through the pages in the report by either clicking on the pages listed below, or by using the keyword search tool below to find specific information within the annual report.-
 1
1 -
2
-
3
-
 4
4 -
 5
5 -
 6
6 -
 7
7 -
 8
8 -
 9
9 -
 10
10 -
 11
11 -
 12
12 -
 13
13 -
 14
14 -
 15
15 -
 16
16 -
 17
17 -
 18
18 -
 19
19 -
 20
20 -
 21
21 -
 22
22 -
 23
23 -
 24
24 -
25
-
26
-
27
-
28
-
29
-
30
-
31
-
32
-
33
-
34
-
35
-
36
-
37
-
38
-
39
-
40
-
41
-
42
-
43
-
44
-
45
-
46
-
47
-
48
-
49
-
50
-
51
-
52
-
53
-
54
-
55
-
56
-
57
-
58
-
59
-
60
-
61
-
62
-
63
-
64
-
65
-
66
-
67
-
68
-
69
-
70
-
71
-
72
-
73
-
74
-
75
-
76
-
77
-
78
-
79
-
80
-
81
-
82
-
83
-
84
-
85
-
86
-
87
-
88
-
89
-
90
-
91
-
92
-
93
-
94
-
95
-
96
-
97
-
98
-
99
-
100
-
101
-
102
-
103
-
104
-
105
-
106
-
107
-
108
-
109
-
110
-
111
-
112
-
113
-
114
-
115
-
116
-
117
-
118
-
119
-
120
-
121
-
122
-
123
-
124
-
125
-
126
-
127
-
128
-
129
-
130
-
131
-
132
-
133
-
134
-
135
-
136
-
137
-
138
-
139
-
140
-
141
-
142
-
143
-
144
-
145
-
146
-
147
-
148
-
149
-
150
 |
 |

12 LETTER FROM THE CHIEF FINANCIAL OFFICER
or insights affect our priorities; and so on. As a result, in
any given year our nance and business leadership engage
in an extensive, ongoing process to work out the trade-offs
necessary to ensure that priorities continue to be met while
available resources are allocated effectively throughout the
rm to build a constantly improving client proposition and
long-term stockholder value. When I talk about disciplined
execution, it’s that process I’m thinking of.
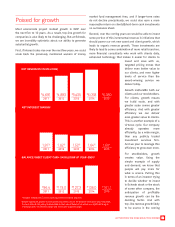
The results
For 2015, we were facing an already lean operating expense
base and a set of priorities, including the launch of Intelligent
Portfolios products and some focused hiring, that we felt
shouldn’t be disrupted absent a dire revenue picture. At the
same time, we were well aware that it was far from certain
that the Fed would make any rate move before year-end, so
we couldn’t count on help from that direction.
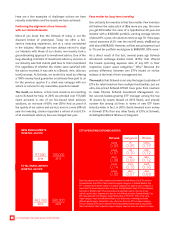
Under those circumstances, we chose to focus on staying
within planned expense levels and held FOE growth to
4%, which enabled us to stick to our expected spending
on projects and marketing while limiting overall expense
growth to 4%. That in turn yielded a 130 basis point
difference between revenue and expense growth and
a 35.7% pre-tax prot margin. Again, not quite what we
hoped or expected starting out, but essentially consistent
with our baseline scenario and great results given the
environmental challenges we faced.
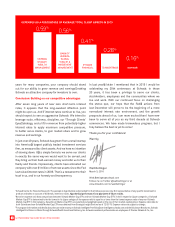
And now…
With that crucial rst Fed rate move behind us, the path
forward could be a bit brighter. As we nalized our annual
planning at the beginning of 2016, the forward rate curve
implied that, despite some global market jitters, the U.S.
economy was strong enough to support expectations for
at least one more Fed move in 2016, and we developed our
baseline scenario with that in mind. Our baseline scenario
also includes relatively at long-term rates and a 6.5%
improvement in the S&P 500 Index relative to year-end
2015, as well as a potential decline in revenue trades as
average portfolio turnover continues to slow.
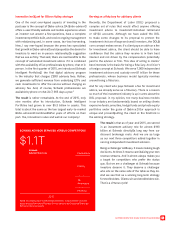
Against that backdrop, we’d expect to produce another
strong year of growth in our client base, and to take
advantage of the breathing room provided by the improving
rate environment to drive harder on reinvestment for future
growth while still delivering a substantial portion of the
rate-driven revenue improvement to our owners through
increased protability. With our baseline expectations
calling for revenue growth in the mid-teens, we planned
for expense growth right around the double-digit mark to
support necessary growth in our infrastructure and allow
for increases in both project and marketing investments
while still delivering a revenue/expense growth gap of at
least 500 basis points. That would represent a pre-tax
prot margin of approximately 39%, another big step on our
journey to higher protability. And while results may vary
29.7%
2011
29.7%
2012
31.4%
2013
34.9%
2014
35.7%
2015
PRE-TAX PROFIT MARGIN