Cemex 2012 Annual Report Download - page 8
Download and view the complete annual report
Please find page 8 of the 2012 Cemex annual report below. You can navigate through the pages in the report by either clicking on the pages listed below, or by using the keyword search tool below to find specific information within the annual report.-
 1
1 -
 2
2 -
 3
3 -
 4
4 -
 5
5 -
 6
6 -
 7
7 -
 8
8 -
 9
9 -
 10
10 -
 11
11 -
 12
12 -
 13
13 -
 14
14 -
 15
15 -
 16
16 -
 17
17 -
 18
18 -
 19
19 -
20
-
21
-
22
-
23
-
24
-
25
-
26
-
27
-
28
-
29
-
30
-
31
-
32
-
33
-
34
-
35
-
36
-
37
-
38
-
39
-
40
-
41
-
42
-
43
-
44
-
45
-
46
-
47
-
48
-
49
-
50
-
51
-
52
-
53
-
54
-
55
-
56
-
57
-
58
-
59
-
60
-
61
-
62
-
63
-
64
-
65
-
66
-
67
-
68
-
69
-
70
-
71
-
72
-
73
-
74
-
75
-
76
-
77
-
78
-
79
-
80
-
81
-
82
-
83
-
84
-
85
-
86
-
87
-
88
-
89
-
90
-
91
-
92
-
93
-
94
-
95
-
96
-
97
-
98
-
99
-
100
-
101
-
102
-
103
-
104
-
105
-
106
-
107
-
108
-
109
-
110
-
111
-
112
-
113
-
114
-
115
-
116
-
117
-
118
-
119
-
120
-
121
-
122
-
123
-
124
-
125
-
126
-
127
-
128
-
129
-
130
-
131
-
132
-
133
-
134
-
135
-
136
-
137
-
138
-
139
-
140
-
141
-
142
-
143
-
144
-
145
-
146
-
147
-
148
-
149
-
150
-
151
-
152
-
153
-
154
-
155
-
156
-
157
-
158
-
159
-
160
 |
 |

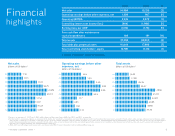
Financial
highlights
1 Based on an average of 1,117.0 and 1,108.5 million American Depositary Shares (ADSs) for 2012 and 2011, respectively.
2 For the reader´s convenience, figures are presented in US dollars. For statements of operations accounts, these figures result from translating the local currency amounts into US dollars at the average exchange rate for the year, which
approximates a convenience translation of the Mexican peso results for 2012 and 2011 using the average exchange rates of the year of 13.15 MXN/US$ and 12.48 MXN/US$, respectively. For balance sheet accounts, US dollar figures
result from translating the local currency amounts into US dollars at the closing exchange rate for the year, which approximates a convenience translation of the Mexican peso amounts at the end of each year using the end-of-year
exchange rate of 12.85 MXN/US$ and 13.96 MXN/US$, respectively.
3 2010, 2011 and 2012 figures are presented in accordance with IFRS. For more information read notes (A) and (B) on page 21.
2012 2011 %
Net sales 14,984 15,215 (2)
Operating earnings before other expenses, net 1,308 967 35
Operating EBITDA 2,615 2,372 10
Controlling interest net income (loss) (904) (1,986) 55
Earning (loss) per ADS1 (0.80) (1.78) 55
Free cash ow after maintenance
capital expenditures 169 191 (11)
Total assets 37,258 38,800 (4)
Total debt plus perpetual notes 16,644 17,986 (7)
Total controlling stockholders’ equity 10,981 11,110 (1)
in millions of US dollars2, except per-ADS data
Net sales
billions of US dollars3
Operating earnings before other
expenses, net
billions of US dollars3
Total assets
billions of US dollars3
03
04
05
06
07
08
09
10
11
12
7.16
8.15
15.32
18.25
20.89
20.13
14.54
14.02
15.22
14.98
03
04
05
06
07
08
09
10
11
12
1.46
1.85
2.49
2.95
2.90
2.33
1.17
0.85
0.97
1.31
03
04
05
06
07
08
09
10
11
12
16.02
17.38
26.76
29.97
49.66
45.39
44.48
40.85
38.80
37.26
8
< previous I contents I next >